![<?echo $_SERVER['SERVER_NAME'];?>](/template/twentyseventeen/skin/images/header.jpg)
Since 2014, Xiao Bian has been deeply exploring ways to optimize the virtual reality experience. Today's small series is about Google’s isometric cube mapping technology that we reported yesterday, a new method for transmitting high-quality VR videos.
Since ancient times, cartographers have been looking for map production methods that accurately reflect the world. The core challenge of this technology is to map the curved globe to flat paper and screens. For thousands of years, countless solutions have emerged, but so far have not found the final unified answer: Each solution is based on trade-offs of the intended use. With the advent of Google Maps and VR video services and applications, which require accurate and useful information about our curved 3D world on a 2D screen, this challenge still exists today.
Traditional mapping technology must address the basic challenge of how to present the world in 2D, and video transmission also faces new difficulties: how to use bandwidth effectively. The transmission of high quality video requires the promotion of network bandwidth restrictions, especially mobile networks. When it comes to VR video, the bandwidth requirement is greatly increased because the image is presented in a complete sphere interface rather than the traditional small 2D window. Stereoscopic video will turn the data back about 1 times. Therefore, we need to focus on how to make full use of the available bandwidth.
Now, Google and YouTube are working together to develop a new solution called isometric cube mapping technology that can make 360-degree and VR video look more realistic today with limited bandwidth.
1. Isometric rectangular projection
The map we are most familiar with is a four-sided grid made up of latitude and longitude lines. This is also known as "equal rectangular projection."
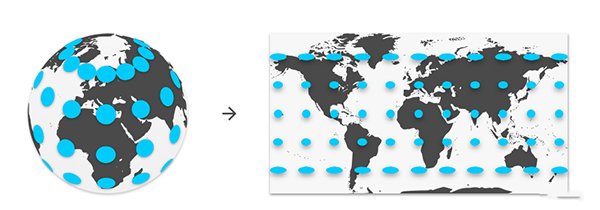
The isometric rectangular projection of the bottom line
The advantage of isometric rectangular projection is intuitive presentation, and the use of existing video editing tools is relatively simple. However, this method can cause serious problems when used for video transmission. First of all, the pole area will get a lot of pixels, while the equatorial part is almost nothing. This is a major challenge, because in the spherical video, the most important content is usually displayed in the equatorial region (center), which is the audience's eye level. In addition, this method can also lead to high distortion, putting more pressure on existing video compression technologies.
In summary, these drawbacks underscore the basic challenge of spherical video projection: how to evenly distribute video pixels on a spherical display surface.
2. Traditional cube maps
One of the methods used by the game industry to optimize the isometric rectangular projection is to cube the map: deform the sphere into a cube, then spread out the six faces and flatten out. As shown below:
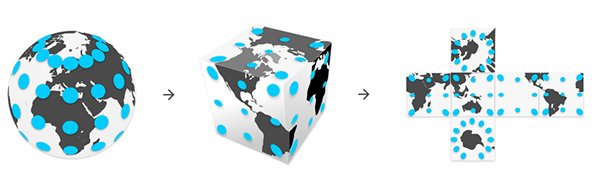
The most straightforward method is to use a simple radial projection: The sphere is embedded in the cube, and the image on the sphere is projected outwards onto the surface of the cube.
This improves the isometric rectangular projection but still does not solve the uneven distribution of pixel density. The problem is that the sides of the cube are closer to the sphere and the corners are further away.
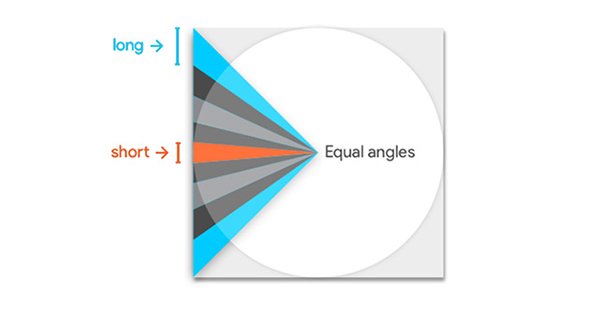
In the figure above, the rays are all equally spaced on the circumference, but the points where the light intersects the square are not equally spaced. The result of this is that corners get more video pixels than the center. Because longer blue light will span more pixels at the edge of the square than red light, this will result in fewer pixels in the equatorial region. In a complete 3D scene, this problem will be more pronounced.
3. Equiangular Cube Map (EAC)
You can solve this problem by changing the position of the video pixels.
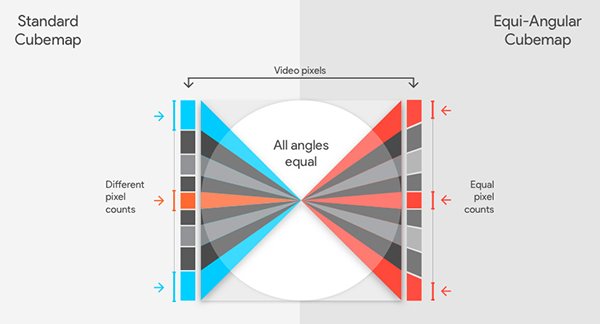
In the figure above, we regard the light emitted from the center as the viewer's line of sight, which is evenly distributed according to the angle. On the left is a traditional cube map that maps linearly from face location to pixel location; on the right is a more efficient EAC mapping.
Depending on the position of the sample on the cube surface, traditional cubic maps will present samples of different lengths. The EAC is specifically designed to ensure consistent lengths and evenly distribute pixels. Drawing is not easy for a variety of reasons. 2D images are difficult to perfectly extend to 3D: You always need to trade off. Keeping one thing means you need to give up other things. You can refer to the information about the conformal mapping and equal area projection. You will find that it is always necessary to sacrifice other things to retain some features. The mathematical calculation of the EAC equation in 2D is very accurate, but in 3D it is only an approximation of the distribution of equal angle pixels, albeit a fairly close approximation.
4. Comparison of uniformity
To visually compare different types of projections, one effective method is to use a saturation map. The saturation map can show the color coding ratio of video pixels to display pixel density. Color coding is from red to orange, yellow, green, and finally blue. Green represents the best pixel density ratio, close to 1:1. Red, orange, and yellow indicate insufficient density (more available display pixels than video pixels, and insufficient video pixels to fill up); blue indicates that there is a waste of resources (less display pixels are available than video pixels and there are extra video pixels). You can change the overall color of the saturation map by increasing the resolution of the video. But for extremely uneven saturation maps, when you turn the area with the lowest saturation into green, this also increases the area where video resources are wasted. Therefore, the ideal projection has a uniform color saturation map because it can form a uniform green color with sufficient resolution.
The degree of saturation is highly dependent on the size of the image and the resolution of the output device. The choice of different resolutions will change the overall green or orange degree. The following saturation map is extracted from a specific case study to compare the effects of different projection methods.
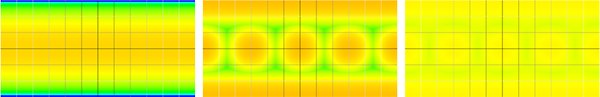
Isometric rectangle projection (left); standard cube map (center); isometric cube map (right)
Obviously, the isometric rectangular projection shows blue in the pole area (too many video pixels), and the equator area is orange (the quality is bad, the video pixels are too few).
In contrast, the standard cube map moves the best green area from near the pole to the equator. There was a wasteful blue area in the original pole, but it has now disappeared. In addition, the color coding ratio of the cube map at the edges is better. The equatorial region shows the most significant changes in saturation. Compared to the worst areas of the isometric rectangular projection, the center of each cube surface is actually lower in quality.
Finally, the saturation map of the EAC projection is more uniform and the quality of the equatorial region is higher. This uniformity allows maximum use of the available bandwidth to select the best pixel density available at any resolution for a given situation.
5. Facts speak louder than words
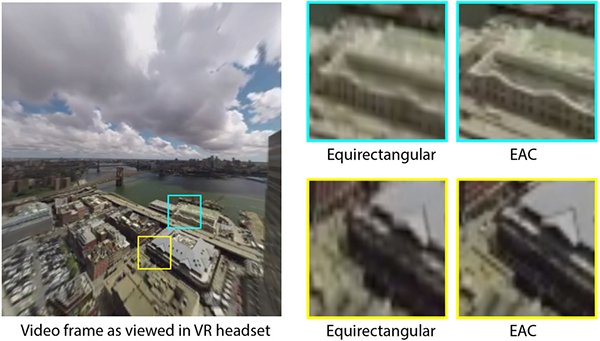
The end result of using EAC projection is that video viewing quality has been improved. The following figure is a screenshot of the left-eye image displayed on the 720P in the 1080P Google Cardboard header, using the same rectangular projection and EAC projection. The larger image is for us to understand the specific scene, and the smaller area for labeling is used for comparison. As you can see, the image becomes clearer after using EAC projection.
Left: Image frames seen in VR heads. Right: The left is an isometric rectangular projection; the right is EAC.
6. Details determine success or failure...
The above describes the general working principle of EAC projection. It solves the rectangular boundaries of the video and layout of the actual mathematics for each surface of the cube. The equation that maps points on a cube surface to video pixel samples is simple.
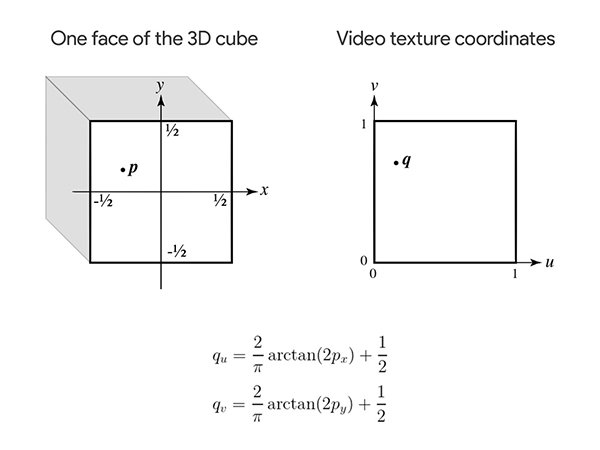
Perform a similar operation for each face.
Now all six [0,1] texture coordinates need to be packed into a single video texture. If the video shape and size are limited by hardware or streaming limitations, these layouts may require special attention, and they may need to be analyzed by themselves. There are many ways to lay out the six faces of a cube as a video rectangle. In addition, discontinuities may occur when faces meet each other, which may cause video coding and pixel interpolation problems when rendering. Similar problems exist in texture atlases used in games. They usually need to be filled with gaps to solve. These details provide the opportunity to choose and weigh the abstract EAC concept.
If you are familiar with OpenGL, you may have noticed that this can actually be solved with cubemap textures and fragment shaders. Yes, you are correct. However, the actual mathematics is left to the reader as an exercise.
Image quality is very important for VR, and the relationship between balanced bandwidth limitations and accurate projection is also critical. After reviewing some of the challenges of isometric rectangular projection and traditional cube mapping, we can see that isometric cube mapping can provide better results and can make more efficient use of resources.
ZGAR PROJECT-D Detacheable Device
Zgar International (M) SDN BHD , https://www.zgarvapor.com