![<?echo $_SERVER['SERVER_NAME'];?>](/template/twentyseventeen/skin/images/header.jpg)
First, review how ADI MEMS defines some of the main specifications. Then, take a quick look at the accelerometer-based tilt detection and related main specifications, and then introduce the autonomous robot example through the rest of the discussion. Next, we will more specifically describe the gyroscope specifications, and carefully analyze various error sources, characterization techniques, and various considerations. Next, an inertial measurement unit (IMU), that is, a combination of various sensors, including but not necessarily limited to accelerometers and gyroscopes, will be discussed. Then there are other relevant considerations of the IMU, and finally a brief summary of the performance of some quality products.
High performance MEMSI believe that everyone has heard the term "high performance MEMS" from various sources. It is true that performance is a relative indicator that varies according to specific application requirements. A single parameter cannot be defined. To this end, it must be clear that relying on a single parameter to characterize the device is one-sided, and people call this situation "special myopia." High performance means that all specifications support key metrics that are important to the application, and an example can be used to illustrate this. For example, a hypothetical gyroscope is used in applications where long-term stability is important. Although this gyroscope is hypothetical, its specifications are real. These specifications are from the data sheet for a quality gyroscope. The key indicator of the gyroscope was initially 10o/hour, which is a commonly used indicator for evaluating the long-term stability of the gyroscope. However, if you look at the parameters of this gyroscope, you can see that its g sensitivity is 0.1o / sec / g. When digitizing the signal, the device has some ADC errors. The reference voltage source is very unstable, but it also produces some errors. Adding all the errors, the zero point stability of the key indicators is 10o / hour, and the total error of the final gyroscope is 72o / hour, which is far from other specifications. Now, it's important not to look at the sources of these specific errors, it's important to explain how to define high performance. The definition must be such that all important performance criteria are complementary, understandable, and clear.
When reading the inertial sensor data sheet, you will find that most parameters come with typical values ​​instead of minimum or maximum values. This is mainly due to economic considerations. It's easier to test typical specifications because you typically only need to sample them in hundreds to thousands of devices without having to test each product. ADI's data sheet policy statement, if we add a minimum or maximum value to the data sheet, we must test the corresponding parameters for each factory product. It is actually very useful if you know the typical specifications. Typical values ​​can have many different meanings. “Typical†may mean the average, where compliance is at most 50% or even lower. Consider the allocation scheme shown in this graph. If the typical value represents the average, the average is about 0 for the zero g offset. In this case, if sampling from a large number of products, the probability of zero-g offset is extremely low. Another meaning of "typical" may be the mean ± 1 Σ, which is one standard deviation from the mean. According to Gauss's rule, this means that 67% of the devices are typical. Most data sheets in ADI have some tolerance coefficients. Therefore, we strive to ensure that 80% of the devices remain within the typical specifications, which is how ADI chose the data sheet.
Another common term in the specification sheet is the initial specification. The initial specification also has two meanings. It can indicate the status observed during the factory acceptance test. This is the test result when the product leaves the test bench. Another meaning of "initial value" can cover any moment when starting and testing the device, such as testing at the factory, testing on the test bench after five months from the factory, or testing by the user five years after the terminal is applied. ADI's initial specifications include any moments to start and test the device. In general, ADI's data sheets use a more conservative approach to both typical and initial specifications to ensure that at least 80% of the devices are operating at typical levels. To this end, we have integrated observations of accelerated aging tests, such as lifetime high temperature tests, temperature cycle tests, impact tests, etc., to better reflect the significance of "initial values" in end applications.
Accelerometer-based tilt detectionTilt detection is a common application for accelerometers. For example, it can be used to directly measure the tilt angle to trigger an operation at a specific location or for platform stabilization. A common application of tilt detection as an accelerometer is the simple triangular relationship between accelerometer output and tilt, as shown in Figure 1. Customers often require a tilt accuracy of about 0.1o and ask if this accuracy can be achieved using our accelerometer. To achieve tilt accuracy of about 0.1o, the offset is controlled to be about 1mg, and the sensitivity error is controlled at 0.1%. Even ADI's highest performance analog output devices, referred to here as core devices, such as the ADXL203, can only provide about 4% sensitivity error and about 25mg offset error. Under this condition, an inclination accuracy of about 3o~5o can be obtained, and some calibration needs to be performed. These specifications all refer to room temperature conditions, and the offset of the device has a temperature coefficient of about 0.5 mg/oC if any tilt within a certain temperature range is to be examined. The sensitivity fluctuates up and down by about 0.3% over the entire temperature range. The most fundamental point is that if you really need a tilt sensor with a precision of 0.1o, you must perform a calibration. Even if calibration has been performed, even after calibrating the device, the mechanical effects must be controlled. The reason is that in the range of 10 mm, even if the difference between the two sides is only 17 μm, for example, the soldering height on the package side is 17 μm higher than the other side, the device to be controlled with precision will produce a tilt error of 0.1°. This condition is a calibrated device and is not necessarily a device error. The device faithfully reports the tilt of the placement location. There are many factors to consider when designing a very high precision tilt measurement system.
Figure 2 shows the different levels of integration offered by ADI's MEMS products. Here, the smallest box represents the lowest level of integration, in this case the two-axis accelerometer ADXL203. This accelerometer has an analog output with an inclination accuracy of approximately 3o~5o. The next box size increases, representing a higher level of integration. The product is the ADIS16209, which uses an ADXL203 core to provide an analog-to-digital conversion function for converting analog output signals to digital output signals. In addition, temperature calibration is added, as well as axis calibration that allows the axes to be accurately perpendicular to each other, while providing some angle calculations, so the ADIS16209 can not only calibrate over the entire temperature range but also between the axes, and can output tilt data. Not just accelerometer data. Here, the largest box represents the highest level of integration. The ADIS16210 adds another axis to the ADIS16209, so a second ADXL203 core is built in. The third axis provides a wider tilt measurement range and, of course, three-axis accelerometer data.
A tilt accuracy of 0.1o requires an offset of about 1 mg and a sensitivity of about 0.1%. It can be seen that in these products, the ADXL203 in the smallest box provides about 3o~5o tilt accuracy, and a higher value requires calibration. As the box gets larger, the calibrated ADIS16209 provides the required 0.1o tilt accuracy over the ±90o measurement range, and the ADIS16210 provides the required tilt accuracy over the ±180o measurement range.
Autonomous robots utilize the most commonly used multi-axis inertial motion. Like most applications, it also takes advantage of linear and rotational information. Environmental conditions are also involved. The left side of Figure 3 is a typical autonomous robot, and the right side is a typical block diagram of navigation in an autonomous robot. The robot uses a boot computer to manage mission objectives, including position changes, or can be called motion. In this particular application, the robot replaces the material conveyor system in the factory. Guide the computer to develop or receive the trajectory that the robot needs to follow, and then use several measurement forms to track the progress of the trajectory. Inertial measurement is primarily through an optical encoder that is coupled to the roller through a series of gears. This method is very effective, but the tire slip, tire diameter fluctuation caused by tire pressure changes, gear gap and other factors are easy to bring the source of error, any such action can cause the robot to move in a way that conflicts with the tire movement. Another measurement method is the laser system. The laser system is accurate but of limited value because the measurement is too dependent on stability and the robot must stop to take measurements. Moreover, when performing measurements, people walking around the robot can cause delays or errors in position or orientation measurements. Therefore, on-chip gyroscopes or inertial measurement unit systems are often used in conjunction with these measurement systems to track orientation or heading in real time. Gyro or IMU systems also have performance limitations that cannot completely replace other systems, but their advantages are also obvious. The robot follows this trajectory without gyroscope feedback or gyroscope assistance. It uses only odometry data and adds gyroscope feedback. The gyroscope used here is a pair of MEMS gyroscopes that use current standards. Since the implementation of this experiment, ADI has improved the performance of gyroscope by about 5 to 10 times at the approximate cost, size and power consumption level. As shown in Figure 4, the y-axis is the error, the x-axis is the time, and the gyroscope also follows the trajectory. The blue portion represents the error of the gyroscope-free feedback system. The green part represents the error of the gyroscope feedback system. It can be clearly seen that when there is no gyroscope feedback, the error is about several centimeters, and even reaches 40 cm. When there is gyroscope feedback, the error is effectively limited to about 20mm, which proves the significant improvement brought by the gyroscope.
GyroWhat is a gyroscope? The role of the gyroscope is to measure the rotational speed of something. Of course, the physics textbook calls it the angular rate of rotation. In most cases, in order to actually integrate the output, as shown on the right side of the screen, the rotation rate needs to be integrated and the actual angular displacement of the device as it rotates is derived. Ideally, the gyroscope will rotate at a specific rate and will give exactly the same signal each time. If the x-axis is treated as a sensor output in LSB, or digital device code, for analog output device units is mV, multiply this value by the scale factor to eliminate any sensor bias, if a neutral voltage or number is discussed Offset the binary number, which will show us the ideal bias. If this relationship is applied to the sensor, it will provide us with the ideal measurement that we can rely on. The quality and cost of the gyroscope is directly related to the extent to which it follows the formula.
Usually the sensitivity involves two different parts in the data sheet: one is the initial sensitivity and the other is the temperature coefficient. As mentioned before, it is not only related to the factory calibration, it is also related to the equipment duty cycle. Sensitivity highlighted in the formula This parameter contains the temperature coefficient. Now our measurement sensitivity is actually relatively simple. It needs to rotate a batch of devices in one direction or the other, which is usually done at the maximum dynamic range supported by the device. It is assumed here that the rotation is made 450°/sec clockwise. The data is then measured and then rotated in the opposite direction using the device. Now, the question is: "Why do we measure the rotation in both directions? The answer is simple: this is for you to control the offset error. If the initial offset error of the gyro is 2 ° / sec, this will affect the sensitivity measurement We do the measurement in both positive and negative directions to remove the effects of the offset error. We will encounter many factors and we will consider these factors to optimize the solution. But in fact, what you really need to do is collect enough. The data, to capture the entire spectrum at a certain sampling rate. When you do averaging, you don't need to worry about undersampling and the effect of noise on DC. You will realize that these measurements are a cyclic process. But the most basic Yes, we want a rotation that is both good and stable in both directions, and we want a high enough sample rate and enough data based on the noise metrics in the data sheet.
ADI is not only selling discrete devices, but also integrated devices, but the difference between discrete devices and fully integrated devices is usually calibration. For example, the ADIS16136 and 265 are 10 to 15 times lower on this indicator than uncalibrated discrete devices.
Linearity is sometimes seen as a subset of sensitivity. There is a reason to put it alone. It may be more convincing to give an example of the relationship between robot performance and sensitivity and linearity. Be sure to note this, because if you buy a gyroscope with poor linearity, linearity takes more time to characterize and understand. It is for this reason that it is presented separately today. In fact, the way in which nonlinearities are measured is very similar to the way in which sensitivity is measured. The only difference is the use of multiple rates. Measurements are not made at the maximum rate, but at several different rates below the maximum. ±10, ±20, ±30, etc. can be used to plot the operating characteristics of the device. 4 red dotted line indicates the sensitivity curve. Reflects the change in slope. The linearity error, more specifically the second-order linearity error, looks almost identical to a slightly upwardly sinusoidal wave. The linearity curve can show the different presentations of the error in the formula. The same principle applies to measuring the relationship between linearity and sensitivity. It must be ensured that the platform is stable; ensure that the rotation rate is accurate; as the curve is formed, the sampling rate is increased as much as possible, and enough data is averaged to obtain good and accurate measurements.
The offset determination term refers to three different items: initial offset error, bias temperature coefficient, and power supply sensitivity. All three can affect the results. If you only consider the equipment you need, the offset is actually the easiest to measure. In theory, as long as the gyroscope is not rotating, vibration-free, or even affected by the vibration of the computer fan - such a small vibration sometimes affects the measurement, as long as the parameters and temperature, power supply are controlled, the gyroscope can be placed on the desktop. Measure the offset. One of the most common situations when starting to measure the offset is the final undersampling of the device. Many gyroscopes provide wide bandwidth response for a number of reasons. Some designers use very low sampling rates when measuring offsets, and in most cases they don't get accurate results. Our first recommendation is that the higher the sampling rate, the better. However, it should be guaranteed to be at least twice as large as any other factor in the device. Second, you must ensure that enough data is collected so that the bias falls below the device noise after averaging. It is critical that when measuring the bias, it is important to understand the factors that affect the device and to ensure that the data is collected and updated at a good sampling rate. The point is here. When discussing the relationship between discrete devices and the fully integrated device ADIS16136, the latter first built a power management system. With a strict linear adjustment rate on the internal regulator, the power supply sensitivity is drastically reduced to a very small level, which is almost imperceptible in characterization. In addition, with factory-calibrated devices, this calibration process can sometimes take hours to further reduce the bias to an extremely low level.
Figure 5 shows a fully integrated gyroscope. Whether using the high-reliability analog output device ADXRS620 or the fully integrated, temperature-calibrated device ADIS16265, this block diagram illustrates the level of integration. First, designers who develop organic designs and have the time, resources, and experience to complete the entire design process. If a system with a stability of 10o/hour is to be developed, assuming that all other conditions have been controlled in the 3.3V system, the error in the analog system must be controlled within 1μV after calibration. This is not impossible, but the designer must know where the bottom line of sensitivity is before starting the design. This not only tells the designer the type of resolution of the analog-to-digital converter, but also the noise parameters, input offsets, etc. that need to be controlled in devices such as amplifiers, buffers, and filters. On this basis, it can be considered which error reduction means to use. The 16136 features high temperature calibration with 10 to 20 times sensitivity and bias performance.
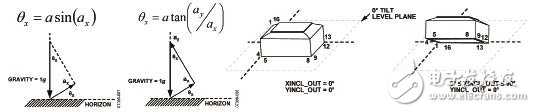
Figure 1 There is a simple triangular relationship between accelerometer output and tilt
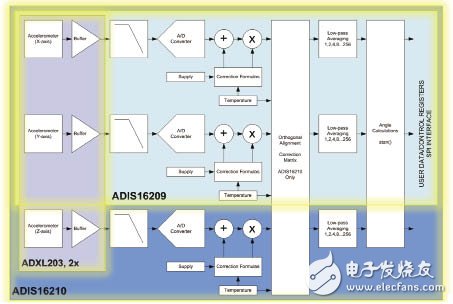
Figure 2 Different integration levels provided by the ADXL203
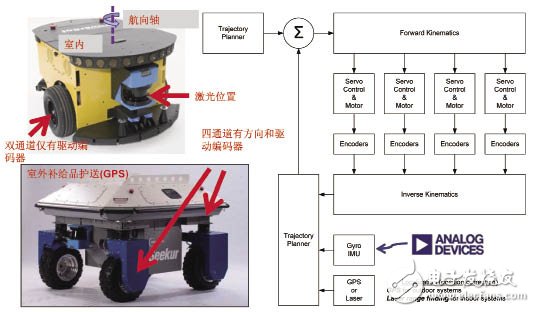
Figure 3 Robot navigation application example
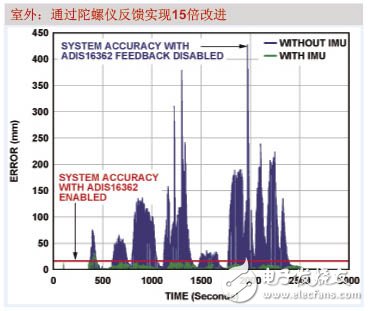
Figure 4 Gyro brings significant improvement
Three different sources of error in the device are the path of sensitivity error, nonlinearity, and bias. As shown in Figure 6, the blue path can be seen as the actual path of the robot. Red is the path assumed by the navigation computer under the influence of sensitivity error, nonlinearity error and offset error. The Ψe and de error terms show the actual difference between heading error and displacement error. The sensitivity error is simple. Assuming I rotate at a specific rate, the gyroscope reading is 10% higher than the actual value, there is a 10% heading error. Since the rate of rotation will translate to the actual instantaneous line speed of the robot, it can be seen that the displacement will actually increase with speed. The degree of nonlinearity is very interesting, sometimes it doesn't matter. But sometimes it also has an impact, for example. Suppose there is no sensitivity error now. It can be said that the graph on the right seems to have a small error, as can be seen from the bottom path. The dashed path represents the bottom linearity, which ultimately leads to a difference in heading and d factor. Suppose I teach my daughter to drive in the parking lot and I drive along the S curve. And she used slalom to drive, 90o to the left, 90o to the right, and finally, although the heading is still the same, there must be displacement. If you look at the second order of the nonlinearity curve, you will find that one side is high and the other side is low, which is the cumulative result. The offset error has already been covered in the previous section. If I drive in a straight line, the offset error will lead to the accumulation of heading error, plus the relationship between the line speeds. At least for the navigation computer, the robot is tortuous and the displacement error is getting larger and larger.
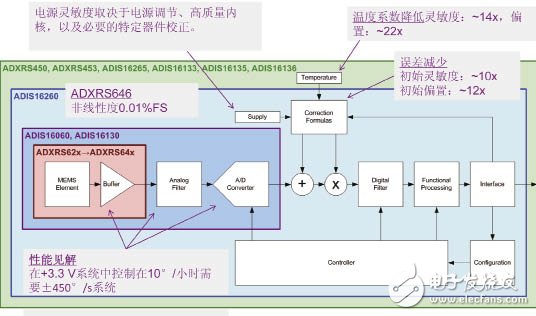
Figure 5 Gyro improves performance through integration
Key kernel featuresThe cost characteristics determine the size and cost difference of the gyroscope. Every factor is important. Noise, stability and vibration performance are high-level, detailed, and key indicators that all systems need to control.
Wideband noise is usually the most important for a stable or feedback system. For navigation systems, it is important to determine the range of averaging, which is used to set the offset, which is the calibration point for stopping and recalibrating the offset. Several factors are listed in the data sheet. The first is the total noise specification, and the unit is usually o/root mean square. There is also noise density, which describes the relationship between total noise and system bandwidth. Of course there is noise bandwidth. Note that the noise bandwidth is not equal to the -3dB point. You can look through noise benchmark books such as Matzenbacher and other classic textbooks that are commonly used in college. On a single pulse system, the noise bandwidth is typically 1.6 times 3dB points. In an integrated gyroscope with two distinct poles, it is usually 1.4. Therefore, it is not allowed to mix all the specifications here. It is important to ensure a stable platform when measuring noise. It should be guaranteed to be in a vibration-free environment. Subtle temperature changes, such as wind blowing the device when collecting data for a long time, will affect the measured value if it is not calibrated. These details need to be noted. Also, always keep controlling the sampling rate and you must collect enough data to get a good statistical sample. For noise density measurements, it is often necessary to perform a fast Fourier transform on a large number of records compared to other methods, and then to find the overall average. Next, a part of the frequency band that is very flat with respect to frequency is selected. We only provide 1/10 of the 3dB bandwidth. This value covers general applications and sometimes lower. Maybe you will ask: Why do people need bandwidth devices? In fact, in platform-stabilized systems, wider bandwidth gives designers more flexibility and provides maximum phase margin that meets feedback loop stability criteria. The above is the case where a wide bandwidth is required. If you need the best accuracy, you can also reduce the bandwidth. For most navigation systems, low frequency characteristics may be equally important, and in many cases even more important.
Before discussing the use of gyroscopes, I need to review the Allan variance square root method for measuring stability. It is a traditional specification incorporating IEEE standards and was invented by David Allan when developing GPS satellite atomic clocks. In fact, it has become the standard tool for measuring the stability of time-varying stochastic processes. First, Ï„ represents the integration time. When the graph is drawn, each vertical line represents a time record of the data. The integration time, which is the time record of the data, should be collected for at least 30 consecutive records, averaging the bias estimates within each record. Repeat the operation 30 times. The actual offset is obtained from 30 measurements and then substituted into the formula at the bottom of the screen. The Allan variance formula will remove a point on the Allan variance curve according to this procedure. For example, "angular random walk", which represents one second of integration time. The implication is that we collect 30s of data and divide the data into 30 segments, each segment being one second. Then find the average of each segment. Finally, for this example, a point of about 60o/hour on the curve is obtained. Again, the most important of these time periods is (temperature change), and if I start the test under the office air conditioning vents and use an uncalibrated gyroscope, the problem is big. It is important to emphasize that it is important to control the sampling rate, control the vibration, and control the temperature of the power supply.
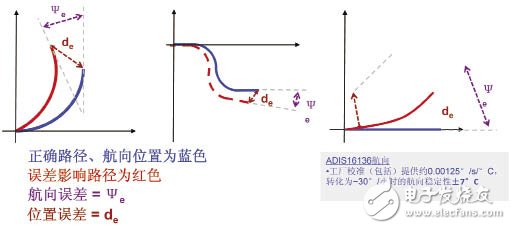
Figure 6 three different sources of error
As the most important indicator, the gyroscope will specify angular random walk and offset stability during motion. Sometimes the rate random walk can be seen on the fiber optic gyroscope, but it is generally not specified on the MEMS gyroscope. Regarding the angular random walk, it can be seen that the formula here is related to 60, basically multiplying the rate noise density by 60 and dividing by the square root of 2, so the rate noise density is related to the angular random walk. Offset stability in motion, often referred to as the resolution of the gyroscope, or the best stability that can be achieved, requires careful control. Finally, rate-random swimming is a long-term measurement that sometimes takes several days to measure, and it can be difficult to use temperature sensitivity alone. This value is usually not specified in the data sheet, but for the latest generation of devices, it is desirable to rate random walks between 2 and 4 degrees/hour/square root hours.
There are usually two factors that affect vibration: the linear g effect, and the rectification characteristics. The linear g is usually a nominal value. If a linear g occurs in a plane perpendicular to the axis of rotation of the device, what is the response within the gyroscope? Ideally, the gyroscope will respond if it is rotated inside the gyroscope. If I move in a linear fashion, the gyroscope does not respond. In reality, when using micromechanical structures, these factors become as important as the bias stability in motion. The key point here is how to measure it? How to observe it? What does it mean in the data sheet? Let's analyze it slowly. In fact, linear g measurement is very simple. In most cases, gravity can be used as an incentive. You can turn the device in one direction, for example upright on one side. It is then flipped to the rotational position, ie a full ±1 g orientation to provide a response. The g&TImes;g measurement is a bit more difficult because these devices, especially the 646 and other devices built into the 646, provide very good response. Therefore, it is generally necessary to increase the g level, measure the impact, and must use a high-end accelerometer for measurement. ADI has now specified this value in the data sheet and can be used to estimate vibration. In fact, it is necessary to rotate in a certain direction and in the opposite direction to obtain a linear g effect, and then leave the g&TImes;g effect.
When the accelerometer is tilted in a direction different from gravity, the acceleration changes. For the linear g effect on the gyroscope, if I put the gyroscope on the table and turn it to 10o with the Earth's gravity vector, the effect will appear so far, this effect is usually observable and calibratable. The device is rated at 0.005o/sec/g2, and its bias stability during motion is impressive, and should be around 2o~4o/hour. In a 2g rms environment, there is not much vibration. For aircraft frames or UAVs, as well as robots driving on the road, the value is reduced to 72o/hour.
Inertial measurement unitMost inertial motions are complex. A single gyroscope is often not sufficient due to the multiple axes involved. In addition, the gyroscope has linear and rotating elements. Also consider the environmental conditions. The inertial measurement unit usually provides at least a 3-axis accelerometer and a 3-axis gyroscope. Some devices also provide a magnetometer to help provide gyroscope feedback. Occasionally, a barometer is also provided to measure altitude changes.
Cross-axis sensitivity is a large distinguishing indicator when developing gyroscope selection and characterization support specifications. For example, for devices that are suitable for mobile phones, such as basic gesture applications, and high-performance devices such as instrumentation applications, cross-axis sensitivity is very important. Currently, the highest performance MEMS gyroscopes are still single-axis devices based on all available metrics. Although industry technology has made great progress, in terms of stability and vibration, single-axis devices still top the list based on all the indicators discussed so far. This means that if you want to design a discrete IMU, you must develop a 3D structure and develop a 3D calibration. Based on our experience in building such devices, the best alignment possible is between 2o and 4o. Achieving 4o alignment with a particular axis can actually achieve about 7% sensitivity. If the robot walks on a ground with a dip angle of ±45o, the heading instability can reach 2.1o. This may not be affected in a short time, but if you try to track the robot from below, such as a group of trees, and there is no GPS access, the problem is coming. By calibrating, the ADIS163xx and 4xx devices reduce this value to below 0.1%, so this value is one of the key metrics. These parameters are usually not available when reading a press release or feature set on a one-page data sheet, although this is not because the manufacturer wants to hide anything, but because the end market does not have this requirement. This parameter is provided to you. The user determines the combination of performances you need to control. All IMUs of ADI are 100% calibrated and come with these parameters. Depending on the device, each device goes through 250 or even 500 steps. All calibrations take hours. These parameters need to be roughly reviewed when developing and purchasing a product at a performance or functional level.
to sum upThe device ADXR646 delivers industry-leading performance across multiple parameters. Its linear acceleration effect and ability to support bias stability during motion over a wide range of vibration conditions. ADI has two different divisions responsible for the design and support of these devices. We are like customers of this device, and they use these services when designing some IMUs and some advanced gyroscopes. Their role cannot be ignored. These specifications are provided to save you time and serve as an important performance indicator. The advantages of purchasing integrated devices over their own hands-on development. Taking 16488 as an example, the sensitivity error can be reduced by 10 to 15 times, not to mention the offset error. In addition, there is often an increase in cross-axis sensitivity. This parameter is much higher than low-level devices designed for handheld applications, such as cell phones, picture rotation devices, or Wii remote devices. In addition to high calibration capabilities, physical structural strength is also one of the advantages, for example, plastic components do not expand or shrink after water. This also contributes to cross-axis sensitivity. Incidentally, these devices were tested at 2 000 g. After hundreds of temperature cycles, the life test, the device still maintains cross-axis sensitivity, which is really a major technological advancement.
Question and answer selectionQ: Is the nonlinearity of the XYZ axis of a three-axis MEMS accelerometer consistent? How does it relate to installation?
A: Under normal circumstances, the Z-axis index is lower than XY due to the back end of the MEMS chip. Errors caused by mounting or soldering can be eliminated by calibration.
Q: What kind of interface does the ADIS16260 use? How to connect with the microprocessor?
A: ADI's digital output MEMS sensors (including the ADIS16260) typically use an SPI interface to communicate with an external microprocessor.
Q: How do I choose an acceleration sensor? What are the main parameters to pay attention to?
A: Depends on your application. The main parameters to be noted are: range; accuracy under DC (sensitivity, nonlinearity, noise, etc.); drift (error with time and temperature).
Q: What are the interfaces between the gyroscope and the MCU?
Answer: The digital output gyroscopes are all SPI interfaces, which can be easily connected to the MCU. For the gyroscope with analog voltage output, the output needs to be connected to the ADC for analog-to-digital conversion.
Q: What is the need to pay attention to the accuracy of 0.1° with ADXL203? For example, high-resolution AD acquisition system? In other words, is it better to improve the accuracy of AD using the ADXl203 tilt angle measurement accuracy?
A: High-resolution ADC is only one aspect. The most important thing is calibration to improve accuracy. A tilt accuracy of 0.1° requires approximately 1 mg of offset and approximately 0.1% of sensitivity, and the ADXL203 provides approximately 3° to 5° tilt accuracy. To achieve higher values, calibration is required. See IMU: ADIS16209 and ADIS16210. The calibration function has been added to the ADXL203. The ADIS16209 provides the required 0.1° tilt accuracy over the ±90° measurement range, while the ADIS16210 provides the required tilt accuracy over the ±180° measurement range.
Q: Please introduce the nonlinearity of the ADIS16488?
A: Different sensors integrated in the ADIS16488 have different nonlinearities. Taking the internal gyro as an example, the nonlinearity is 0.01% times the range in the 450deg/sec range.
Q: Which ADI sensors have temperature compensation? How wide is the temperature range for compensation?
A: The general IMU (the device at the beginning of ADIS) is temperature compensated. For the temperature range of compensation, please refer to the temperature range of the temperature drift indicator in the data sheet.
Q: What is the current MEMS multi-degree of freedom of ADI?
A: At present, our products can reach 10 degrees of freedom, 3-axis gyro, 3-axis accelerometer, 3-axis magnetometer, and 1 barometer, which is a single-chip INS solution.
Q: What are the main factors affecting the nonlinearity of the gyroscope? Need to fix it?
A: The main factor affecting the nonlinearity of the gyroscope is the process impact of the MEMS itself. Whether it needs to be corrected depends on your application. If the nonlinearity indicator does not meet the requirements, higher performance MEMS and IMU can be selected, and their high performance is achieved by internal calibration.
Q: What is the maximum communication rate between the gyroscope and the mcu interface?
A: The communication rate between ADI's digital gyroscope and MCU needs to look at the specific model. Usually, the data read rate is KHz.
Q: What are the main aspects of noise that affect MEMS measurement accuracy? How to reduce?
A: There are many factors that affect the accuracy of MEMS measurement, such as noise, temperature drift, nonlinearity, non-orthogonality, vibration, shock, linear acceleration effects. Noise can be reduced by using multiple chips on average. Temperature drift, nonlinearity, non-orthogonality, etc. can be corrected by software. The most difficult thing for users to control is the influence of vibration, shock, and linear acceleration. Pay attention to the linear acceleraTIon effort on bias indicator, because these effects are mainly guaranteed by the design of the device itself.
Q: Do MEMS accelerometers need to be calibrated continuously during use? Is it done through software?
A: Most of ADI's sensors are calibrated before leaving the factory, and users can calibrate them according to their needs.
Q: What are the response speeds of the ADI gyroscope, and what is the fastest?
A: First, it depends on the startup time, which is generally at the ms level. For example, the ADXRS642 startup time is up to 50ms. Then look at the bandwidth of the device, ADXRS642 is 2000Hz.
Q: Are high performance MEMS primarily used in handheld products? Still applied to other high-end products?
A: ADI provides sensors for consumer electronics, such as ADXL345, 346, etc. For gyroscopes, it focuses on non-consumer electronics such as platform stability control, navigation, robotics and UAVs.
Q: Does ADI's MEMS have unique innovation advantages?
A: Before the sensor was shipped, ADI did a lot of testing and calibration work to improve the performance of the chip and reduce the workload of the engineer. Take our MEMS gyroscope as an example. At least two sensor units (four in the ADXRS64x) are used inside, which has a good inhibitory effect on external influences such as acceleration.
VGA, or Video Graphics Array, is a standard for Video transmission using analog signals. Early CRT displays could only receive analog signal input due to design and manufacturing reasons, so the video card inside the computer was responsible for digital-to-analog conversion, and the VGA interface was the interface for the output of analog signals on the video card. Today, LCD monitors can receive digital signals directly, but in order to be compatible with VGA interfaces on video CARDS, VGA standards are mostly supported.
In VGA video transmission standard, the video image is decomposed into red, green and blue primary color signals. After digital-to-analog conversion, the video image is transmitted in three independent channels under the synchronization of HSYNC and VSYNC signals. The synchronization timing of VGA in the transmission process is divided into line timing and field timing. VGA timing consists of three elements: pixel clock, row field synchronization signal, and image data.
Early VGA specifically refers to the resolution of 640X480 display mode, later, according to the resolution, VGA is divided into VGA (640X480), SVGA (800x600), XGA (1024x768), SXGA (1280x1024), etc. VGA display timing at different resolutions is similar
Tv With Vga Port,Tv With Vga Input,Vga Output To Hdmi Input,Vga Input To Hdmi Output
TONYA DISPLAY LIMITED , https://www.tydisplay.com