![<?echo $_SERVER['SERVER_NAME'];?>](/template/twentyseventeen/skin/images/header.jpg)
There is no eternal happiness in the world. If there is, it must be learning. Follow the editor to increase your knowledge. Today, the editor will share with you the relationship between throughput and various variables from 5 aspects.
What are you waiting for? Get ready soon. It's learning time.
Knock on the blackboard: the focus of this article:
1. What is throughput
2. Hardware influence factors
3. Software influence factors
4. Influencing factors of antenna
5. Test related influence factors
1. What is Wi-Fi throughputa) In layman's terms, Wi-Fi throughput is the actual maximum rate supported by Wi-Fi devices (AP/STA) on the uplink and downlink. It is a kind of limit test and is closer to the actual user scenario, especially Today, when products are becoming more and more wireless and wired network port designs are gradually fading out, this is particularly important. The Wi-Fi throughput mentioned in this article is a Wi-Fi throughput test at the application layer, which is suitable for high data transmission application scenarios.
b) Wi-Fi throughput is a more general concept. In the actual test, it needs to be divided into modes and channels.
Such as IEEE 802.11n HT40 mcs7 ch1, IEEE 802.11ac HT80 mcs9 ch36 and so on.
Note: MCS is Modulation and coding scheme. Different numbers represent different modulation and coding schemes. Different modulation schemes correspond to different rates. You can check the 802.11n/ac protocol for details.
c) According to different verification purposes (application scenarios) of Wi-Fi throughput, there are multiple methods
1. For example, when verifying the Wi-Fi throughput inflection point, different attenuation values ​​need to be set through the attenuator;
2. For example, several typical scenarios for verifying the coexistence performance of wireless systems:
1) Verify the coexistence performance of the product using Wi-Fi+Bluetooth combo chip (verify the product Wi-Fi and Bluetooth time slot allocation and channel avoidance mechanism, the principle is the same as 4G and Wi-Fi coexistence), the Bluetooth function of the product needs to be switched on and tested;
2) When testing the throughput of a single Wi-Fi device, plus a Bluetooth device, it can be subdivided into two states: Bluetooth only connection and data transmission;
3) The Wi-Fi device and Wi-Fi device coexistence scenario is to add other Wi-Fi devices during the test. The device can work on the same channel/adjacent channel currently being tested. It can also be subdivided into only connection and data transmission. Kind of state
3. For example, verify the influence of Wi-Fi driver, which is more obvious at close range;
4. For example, to verify antenna performance, different directions, angles and distances need to be distinguished.
5. For example, verify the influence of temperature on throughput. Various permutations and combinations of the above types can also be performed as needed.
d) How to judge whether Wi-Fi throughput is good
If you want to keep improving, compare the data of the same specifications and models in a clean and stable environment as a benchmark.
Generally speaking, the measured value at close range and zero attenuation needs to reach more than half of the theoretical value of the RF chip. For example, the theoretical rate is 150Mbps, and the maximum test value needs to be above 75Mbps; the measured value under close distance with attenuation is the same as the power and sensitivity of Wi-Fi OTA Related to antenna performance, its performance needs to be compared with the data under the same test state to determine.
In addition, when designing and selecting the product, it is necessary to consider the application scenarios of the product's own data transmission requirements and the maximum theoretical rate of the communication interface used in the product design. Do not blindly pursue a Wi-Fi solution with a high specification rate, resulting in waste of design costs, such as 802.11ac The maximum theoretical rate of the HT80 1T/R can reach 433.3Mbps, but the product uses the SDIO V2.0 communication interface, which is actually unable to reach half of the theoretical value.
2. Hardware influence factorsThe impact of hardware on throughput can be distinguished from chip selection, layout design, RF index debugging, and mold structure. Only a brief overview can be made here.
a) Chip selection---choose the chip suitable for the product application
The parameters related to throughput include PHY layer data rate, support interface, typical conducted Tx power, typical EVM, etc. In addition, the ability of the chip to resist packet loss needs to be measured. The theoretical rate of the physical layer and the type of communication interface supported will directly determine the throughput of the product designed with this chip, the power determines the transmission distance, and the EVM determines the signal modulation quality.
b) Layout design (not detailed here)
Here is mainly focused on using SI9000 (or other tools) to select the reference layer, the length of the microstrip line of 50 ohm, the bend and the impedance control of the trace, the isolation of multiple Wi-Fi signals, the processing of the Wi-Fi part of the power supply, and interference Device layout, thermal design, shielding design, etc. will affect Wi-Fi radio frequency indicators.
c) Conducted RF indicator debugging
1. Transmitting power, the power can be adjusted in design according to the actual application of the product, and the power is directly related to the distance of the transmission.
2. Here also need to focus on EVM
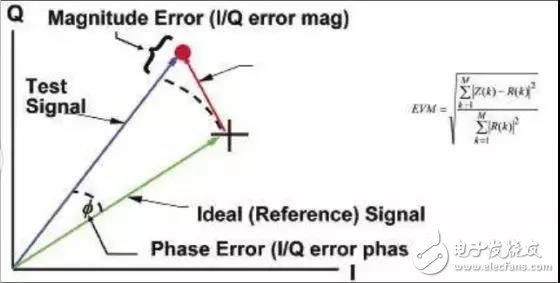
It measures the degree of deviation of the ideal constellation position of the modulation mode corresponding to the demodulated signal. Excessive EVM will cause symbol errors, and data cannot be confirmed to be received, which deteriorates to an error rate and causes packet loss.
3. SensitivityTo measure the anti-packet ability of the device, it is mainly related to the chip ability and layout layout. It can also be processed to optimize performance through shielding measures. It should be noted that the verification method of conduction can only partially reflect the anti-interference ability of the product, and the sensitivity test of Wi-Fi OTA More comprehensive verification.
d) Design of mold structure
The main focus is on whether the space reserved for the antenna design, the assembly of the antenna, and the appearance and material of the whole structure will affect the wireless signal transmission.
e) Hand-soldered test board
If the chip or module and Ipex terminals of the test board are soldered by hand, it will also affect the throughput performance.
f) Welding of antenna
If a soldered antenna is used, the exposure of the coaxial core wire soldered to the PCBA antenna feed point will also affect the throughput; if it is a metal patch or plug-in antenna, the amount of tin on it and the flatness of the antenna mounting It will also affect throughput.
3. Software influence factors
Hardware engineers usually pay more attention to the Wi-Fi spurious test and Wi-Fi conduction indicators in EMC. They don’t know exactly what changes the software engineer has made. Sometimes if the software engineer doesn’t check the code carefully, he’s not clear about the difference. The software version is different, because the middle will also involve whether the original chip manufacturer has optimized at the bottom. Combining actual experience, Ban Mei suggests that attention should be paid to the following aspects:
a) Whether the equipment is upgraded correctly during the test
Sometimes if the software package is incomplete or damaged, only part of the mode and rate can be supported after the upgrade
b) Whether the driver version is correct
It is recommended to verify the throughput for every driver update.
c) If the driver is correct and the OS is upgraded, is there a patch to optimize performance?
4. Influencing factors of antennaThis is mainly for the PCBA board RF performance to reach the standard, after the mold is determined, the throughput of the whole machine is verified.
Antenna is a passive component, which mainly affects OTA power and sensitivity, coverage and distance, while OTA is an important means of analyzing and solving throughput problems. Usually we mainly measure the antenna according to the following parameters (the following parameters do not consider laboratory errors, actual The antenna design performance will also affect the throughput performance):
a) VSWR
A measure of the degree of reflection of the input signal at the antenna feed point. A good value does not mean that the antenna performance is good, but a bad value means that the energy input from the PCBA end to the antenna feed point is reflected more. Compared with the antenna with a good standing wave, the power that can be used for radiation has been reduced.
b) efficiency
The ratio of the power radiated by the antenna to the power input to the antenna feed point. This indicator will directly affect the Wi-Fi OTA power (TRP) and sensitivity (TIS) performance.
c) Gain
Represents the power ratio between a certain position in the space direction and the ideal point source antenna when the same input power is input. The passive data of OTA is usually the maximum gain value of a single frequency (channel) on the spherical surface, mainly related to the transmission distance related.
d) TRP/TIS
These two comprehensive indicators are obtained by integrating the entire radiation sphere of free space (which can be understood as an OTA laboratory environment) and then taking the average value, which can intuitively reflect the Wi-Fi of the product (PCBA hardware + mold + antenna OTA performance) performance.
When the TRP/TIS test differs greatly from the expectation, you need to pay attention to whether Wi-Fi enters low power consumption mode. For battery-powered products, you need to check whether the battery is sufficient when testing; in addition, TRP needs to pay attention to ACK and non-ACK modes. And TIS has always been the focus and difficulty in OTA. After all, conduction can only reflect part of the interference situation. In addition, software factors will also have an impact on TIS.
TRP/TIS can be used as an important means for Wi-Fi throughput analysis.
e) Direction map
It is used to qualitatively evaluate the product's radiation coverage in space. The test data is usually distinguished by frequency (channel). Each frequency has three surfaces H, E1, and E2 to characterize the signal coverage of the entire spherical surface of the antenna. When Wi-Fi products are actually used at a relatively long distance (the directional pattern cannot be characterized when the distance is close), the wireless signal coverage of the product is actually verified by testing the throughput at multiple angles.
f) Isolation
Isolation measures the isolation of Wi-Fi multi-channel antennas and the mutual coupling between antennas. Good isolation can reduce mutual coupling between antennas, and has a better pattern, so that the whole machine has better wireless signal coverage .
5. Test related influence factorsPay attention to the following details when testing
a) Selection of test environment (this is the pain point of throughput testing)
1. Shielded darkroom
The analysis and verification in the research and development stage is recommended to be carried out in a shielded dark room to shield the influence of various wireless signals, especially the channel congestion caused by the influence of Wi-Fi co-frequency and adjacent frequency signals and the reduction of the theoretical rate in the current environment; attenuator simulation can be added Actual distance (without considering the effects of multipath and signal fading), but this "simulation of distance" is based on the premise that the antenna gain of the auxiliary test Wi-Fi equipment (AP/STA) is "XXdBi", what is its practical significance , It needs to be considered by the experimenter. There is no problem with the test data on the same site as the database for product performance analysis.
2. The actual environment
Wi-Fi throughput verification in the actual network or underground parking lot I personally think that it can only be used as a field auxiliary verification after the laboratory verification is completed. The known 4G, Bluetooth, Wi-Fi signal and even some wireless signal multiplier interference, And buildings, people walking, vehicles moving, etc. have a greater impact.
b) Router selection
The mode and rate supported by the tested router are higher than those of the tested device. For example, the device is 802.11n-HT40 2T/R with a maximum theoretical rate of 300Mbps. It is best not to choose a router that can only support up to 300Mbps. At least choose 802.11n-HT40 3T/R 450Mbps router.
c) Choice of test APK
Common ones are Ix chariot and Iperf. When using Ixchariot, it is recommended to select high performance throughput script for the script. When using Iperf, it is recommended to set the time to 60s to minimize test contingency.
d) Aid to test the influence of computer OS
Windows 7 and Windows 10 will have a greater impact on the results.
e) Router settings
It is necessary to set the mode, bandwidth and channel of the switch router during the test, so it is necessary to know the specifications of the tested device in advance
f) The relative position and distance between the tested equipment and the router
Test every 15° or 30°, the test distance is selected according to the application characteristics of your product.
g) Placement of the tested equipment
Simulate the normal use of users, as high as possible, and at the same level as the router; you can also set the limit position test by yourself.
Throughput testing is too time-consuming and laborious, and the environmental impact is great. Banmei suggests that it is more time-saving to use automated testing in a shielded environment, and data consistency is also good.
Wall Boiler Pressure Gauge,Digital Tire Gauge,Boiler Manometer,Capillary Tube Pressure Gauge
ZHOUSHAN JIAERLING METER CO.,LTD , https://www.zsjrlmeter.com