![<?echo $_SERVER['SERVER_NAME'];?>](/template/twentyseventeen/skin/images/header.jpg)
Whiteness is a characteristic of high reflectance and low color saturation. White is not a single wavelength but a range of colors that fall within the 470–570 nm spectrum. Typically, its brightness (Y) is above 70, and its excitation purity (Pe) is less than 0.1. Although white is not monochromatic, most observers can perceive differences in whiteness based on spectral reflectance, excitation purity, and dominant wavelength. However, the perception of whiteness varies between individuals and depends on factors like lighting conditions and personal preferences.
For example, some people may prefer a white with a slight red tint, while others might favor a bluish or greenish tone. Additionally, the same sample can appear differently under different light sources or brightness levels. In industrial settings, two common methods are used to evaluate whiteness: colorimetric comparison with a standard and measurement using a dedicated whiteness meter.
Colorimeters compare the sample against a known standard, while whiteness meters use built-in formulas to calculate and display the value directly. This method is more objective since it relies on consistent measurement conditions, reducing subjectivity in evaluation.
One method is the colorimetric approach, which involves comparing a sample to a standard with known whiteness. Another is using a specialized instrument designed for measuring whiteness.Many instruments store multiple whiteness calculation formulas. When measuring, the device automatically selects the appropriate formula based on user settings and provides an accurate whiteness value. This ensures consistency and objectivity in the results.
First, the whiteness calculation formula derived from ideal whiteThis type of formula calculates the color difference between the sample and an ideal white reference. One well-known example is the Hunter whiteness formula.
(a) Hunter Whiteness FormulaThe Hunter formula defines the whiteness of a fully reflective diffuser as 100. It evaluates the sample's whiteness by calculating the difference between the sample and this ideal reference. The formula uses the L, a, b values from the CIELAB color space, where L represents lightness, and a and b represent chromaticity coordinates.

In general, when no fluorescence is present, a_p = 0.00 and b_p = 0.00. For fluorescent samples, a_p = 3.50 and b_p = -15.87.
(2) CIE1982 Whiteness Evaluation Formula (Gantz Formula)The CIE1982 formula is the only one officially recommended by the International Commission on Illumination (CIE). Proposed by Ganz, it has three variations depending on the preferred white tone:
1. For blue-white preference:

2. For red-white preference:

3. For neutral achromatic preference:
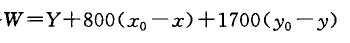
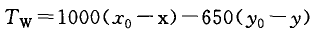
The formula uses x₀, y₀ as the chromaticity coordinates of ideal white and Y, x, y as the sample’s brightness and chromaticity. W represents the whiteness value, and T_w indicates the tone offset—positive values mean greenish, negative values mean reddish.
Second, the whiteness determination formula derived from experimental sample reflectance 1. Single-band Whiteness FormulaSome formulas express whiteness based on the reflectance in specific spectral regions. For example:
(1) Using G (green light reflectance) to indicate whiteness.
(2) Using R₄₅₇ (blue light reflectance) to determine whiteness.
The ISO standard uses a 457.0 nm blue light with a half-peak width of 44 nm to measure paper whiteness, calling it "ISO whiteness" or "blue light whiteness."
2. Multi-band Whiteness FormulaThese formulas use reflectance values across multiple bands. One example is the Taube formula:
W = 4B - 3G
Another is the yellowness index formula:
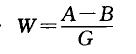
Reflectance values A, G, B correspond to red, green, and blue bands, respectively. These values can be calculated from tristimulus values using filters.
While these formulas have their advantages and limitations, they are widely used in industry. Instruments such as the precision colorimeter series (CS-200, CS-210, CS-220) and spectrophotometer series (CS-580, CS-600, CS-610, CS-660) support various whiteness calculations and provide accurate readings for different applications.
According to the conversion method, Load Cell is divided into 8 categories, such as photoelectric type, hydraulic type, electromagnetic force type, capacitive type, magnetic pole change type, vibration type, gyro ceremony, and resistance strain type. It is a method that converts quality signals into measurable electrical signals The output device mainly has several styles such as S type, cantilever type, spoke type, plate ring type, bellows type, bridge type, and cylinder type.
The sensor has the following advantages:
(1) High impedance, low power, only requires very low input energy.
(2) Larger variation can be obtained, thus having higher signal-to-noise ratio and system stability.
(3) The dynamic response is fast, the working frequency can reach several megahertz, dense b contact measurement, the measured object can be a conductor or a semiconductor.
(4) The structure is simple. Strong adaptability, can work in harsh environments such as high and low temperature, strong radiation, etc., and has a wide range of applications.
Load Cell,Load Cell Sensor,Single Point Load Cell,Weight Cell
Xiaogan Yueneng Electronic Technology Co., Ltd. , https://www.xgsensor.com