![<?echo $_SERVER['SERVER_NAME'];?>](/template/twentyseventeen/skin/images/header.jpg)
Continuous monitoring of cardiac activity measures heart rate variability (HRV), which provides insight into heart health and other diseases.
This design example is a new pulse oximeter design that is simple to use and powerful. With excellent performance, it can even be used as a stand-alone device to monitor heart rate and oxygen saturation.
The core components of the system include a super bright red LED (KA-3528SURC), an infrared LED (VSMB3940X01-GS08), and a photodiode (VBP104SR) that is equally sensitive to the wavelength of both lights.
The operational amplifier LT6003 is the basic building block of the entire system and is used in several amplifier stages of the circuit. In Figure 1, IC1 acts as a transimpedance amplifier that converts the current produced by the photodiode into a voltage. This level provides high gain so that Sensors can be used in almost every part of the body. The operational amplifier IC2 acts as an inverting amplifier with a gain of 30 times.
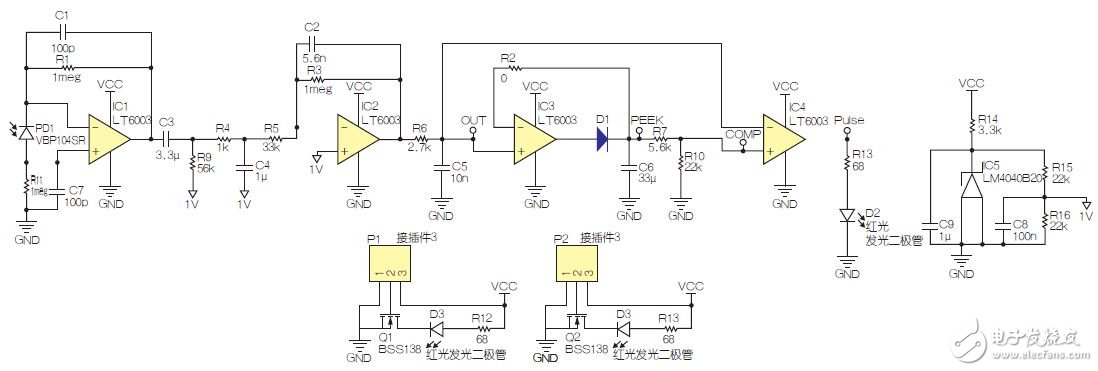
Figure 1: Pulse oximeter.
The comparator IC4 negative input is connected to the correction signal using a peak detector circuit. Components such as IC3, D1, and C6 are used to detect and maintain the maximum voltage of the input signal. R7 and R10 are used to discharge the C6 capacitor. This circuit is used as a reference voltage, and even a sudden change in the position of the sensor on the human body is detected.
The circuit is equipped with a high-pass filter and two low-pass filters to filter out unwanted interfering signals from external light changes or AC flashing. The frequency of the high pass filter and the first low pass filter are set to 0.86 Hz and 159 Hz. The other terminals of the high-pass filter and the low-pass filter are not grounded, but are connected to a 1V reference voltage to increase the bias of the sense signal for subsequent processing. The reference voltage is generated by the LM4040 and the voltage divider (R15, R16). After IC2, a second low-pass filter with a frequency of 5.9 Hz processes the signal to further filter out other unwanted interfering signals (see Figures 2 and 3).
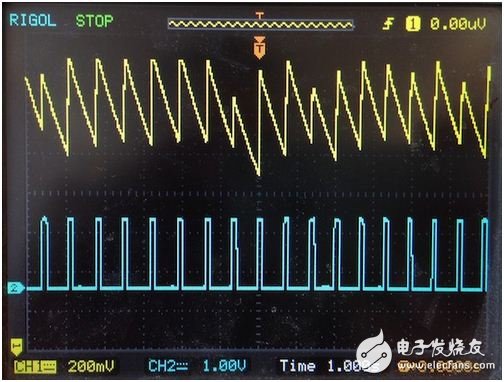
Figure 2: Voltage output of COMP node (CH1) and pulse node (CH2) as a function of time.
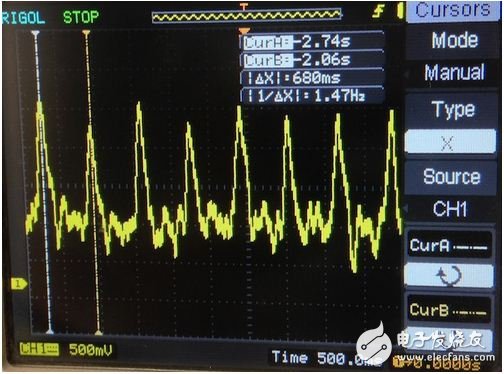
Figure 3: Signal on the output node.
This paper does not discuss the pulse reading process, which can be done by an MCU with an ADC. The MCU is used to control the LEDs, detect the signal, and convert the signal to blood sample saturation. Blood oxygen saturation can be calculated even with a narrow-band bandpass filter. When the red LED is lit, the ADC begins to detect the signal. After two or three pulses, the infrared LED can be illuminated simultaneously with the red LED. The MCU is calculated using the S=VR/VIR formula, where the voltage is the peak-to-peak reading and S is the value in the tissue oxygen saturation (StO2) calibration table.
550KW Gas Generator Set,550KW Gas Genset,550kw Generator Set,550 Kw Gas Generator
Jinan Guohua Green Power Equipment Co.,Ltd. , https://www.guohuagenerator.com