![<?echo $_SERVER['SERVER_NAME'];?>](/template/twentyseventeen/skin/images/header.jpg)
Key words: multi-feature; BP neural network; brain-computer interface; motion imaging; Alpha wave
CLC number: TN98
Document identification code: A
DOI: 10.16157/j.issn.0258-7998.171826
Chinese citation format: Liu Guangda, Wang Can, Li Mingjia, et al. Brain-computer interface based on multi-features and BP neural network[J].Application of Electronic Technique, 2017, 43(9): 72-75.
English Reference Format: Liu Guangda, Wang Can, Li Mingjia, et al. Research of brain-computer interface based on multi-feature integration and BP neural network[J].Application of Electronic Technique,2017,43(9):72- 75.
0 Preface
Electroencephalography (EEG) has complex signal components and can be divided into different waves according to different frequency bands [1].
The Alpha wave in the EEG signal is more obvious in the human prefrontal lobe, which is the most obvious rhythm compared with other EEG signals, and appears more frequently when awake and closed. When a person thinks about a problem, opens his eyes, or is exposed to other external stimuli, the Alpha wave disappears; when he closes his eyes again, the Alpha wave reappears. This phenomenon is called Alpha wave blocking [2]. Studies have shown that Alpha waves are related to human memory, motor and sensory activity [3], and this correlation is important for judging brain movement intentions.
Using the Brain-Computer Interface (BCI) system, the acquisition of EEG signals, preprocessing, feature extraction and pattern classification, to achieve motion imaging recognition is the focus of current research.
In recent years, methods for extracting features of motor imagery EEG signals include autoregressive model method (AR) [4], statistical feature extraction [5], and frequency domain analysis [6-7]. The main classification methods of EEG signals are linear discriminant classification methods, neural networks, etc. [8].
In the process of feature extraction of EEG signals, pattern classification using single eigenvalues ​​will result in large amount of training data, long time, and even affect classification accuracy. Therefore, this study combines multiple features and combines BP neural network to extract and classify Alpha waves in EEG signals, which has the advantage of high recognition accuracy. Through the feature extraction and pattern classification of the motor image of the motor imagination, the imagination of the imaginary can be judged, and the brain-computer interface is combined to have great development prospects in the rehabilitation, auxiliary control and entertainment of the disabled. 9].
1 Feature extraction method and test of EEG signals
1.1 Autoregressive Model Method (AR)
The AR model is convenient to calculate. The single-channel EEG signal is composed of active segments of n sampling points x0...xn-1. According to the AR model, the kth sample value xk in the signal is as shown in equation (1):
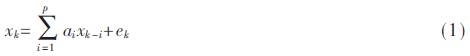
Where ai is the AR model coefficient, p is the order of the model, and ek is the residual white noise.
The methods for estimating the parameters of the AR model include autocorrelation method, improved covariance method and Burg algorithm. The Burg algorithm is simple in calculation and produces high spectral quality. Therefore, this study uses the Burg algorithm to estimate the parameters of the AR model. It is verified by experiments that the AR model Burg method estimates the model parameters p=3.
1.2 Statistical feature extraction
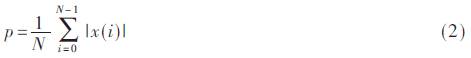
(1) EEG signal integral value
Let the EEG signal be x(i) and the data length be N. The integral value is calculated as shown in equation (2), which represents the degree of concentration of the signal.
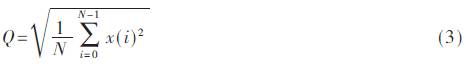
(2) EEG signal root mean square value
The root mean square value of the EEG signal is as shown in equation (3), which reflects the degree of dispersion of the signal.
1.3 Frequency domain analysis
In this study, several characteristic values ​​of the power spectrum, the average power frequency, and the power spectral density ratio are selected.
Think of the EEG signal as a random signal x(n), with N-point sample values ​​and limited energy, Fourier transform to obtain XN(ejω); then take the square of the amplitude and divide by N, as x ( n) The power spectrum P(ejω)[10], as shown in equation (4):
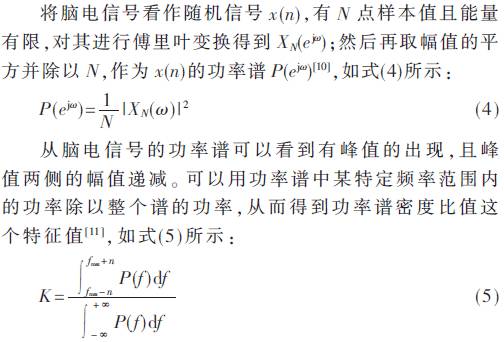
Where fmax represents the frequency at which the power spectrum peaks and n represents the integration range.
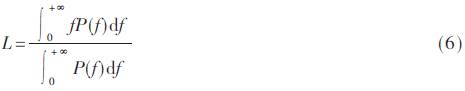
The average power frequency refers to the calculation of the average power frequency of the EEG signal in the frequency domain, and can quantitatively characterize the spectrum of the EEG signal. The calculation formula is as shown in Equation (6):
1.4 Feature test
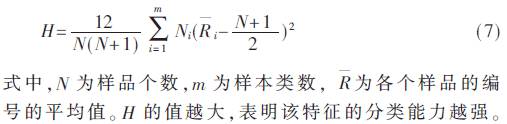
In order to improve the correct rate of classification, the extracted eigenvalues ​​were tested by KW test. The KW test is as shown in equation (7):
The KW test is performed on the 600-segment eigenvalues ​​in the four directions of front, back, left, and right. The results of the test are shown in Table 1.
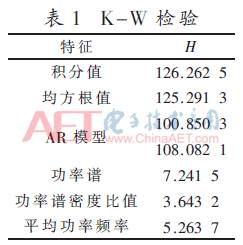
It can be seen from Table 1 that the three characteristics of the integral value, the root mean square value and the AR model have higher values, and the three are selected as feature vectors and sent to the classifier for classification.
2 Classification of EEG signals
After extracting the eigenvalues ​​of the EEG signals, the BCI system selects the BP neural network to classify these feature vectors.
The BP neural network used in this study has 4 input layers (representing 4 eigenvalues), 7 hidden layers, and 4 output layers (representing the number of classifications to be 4), as shown in Figure 1.
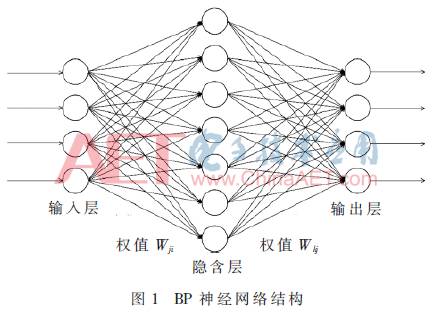
A three-layer network can perform the required mapping in the case of a limited number of neurons. The BP network learning process consists of forward and backward propagation. The input signal xi acts on the output node through the intermediate node. After nonlinear transformation, the output signal yk is finally generated. The network training sample contains the input vector and the expected output, and the actual output of the neural network. The deviation of the person is achieved by adjusting the connection weight Wji between the input node and the hidden layer node and the connection weight Wkj between the hidden layer node and the output node and the threshold value, so that the error is reduced. After repeated training, determine the weight and threshold of the corresponding neural network when the minimum error is approached. At this time, the training ends [12].
3 experiment and analysis of results
3.1 Experimental system design
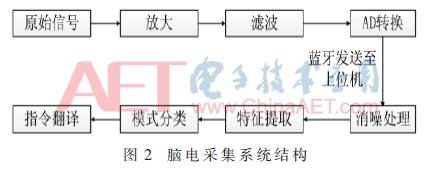
The structure of the electroencephalogram acquisition system of this experiment is shown in Fig. 2. The acquisition electrode extracts the EEG signal, amplifies the weak EEG signal through the amplifier, filters the interference, and then converts it into a digital signal via A/D, and sends it to the Bluetooth via Bluetooth. The upper computer performs processing.
3.2 Experimental conditions and methods
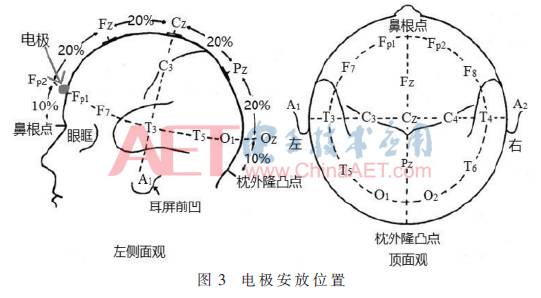
The electrode position is placed according to the Montreol method [13], the international standard lead 10-20 system, as shown in Figure 3. The electrodes were placed on the prefrontal lobe of the subject to collect an Alpha wave, the arrow being referred to as the electrode placement position, and the ear clip used as the reference electrode was clamped on the left and right earlobe.
In order to ensure the accuracy of the collected data, the Schulte square method [14] was used in this study to train the subjects' attention before the experiment.
3.3 Experimental process
The subjects were young males with good health, normal vision after correction, and right hand. The laboratory environment is quiet and the room temperature is normal. The electroencephalogram acquisition electrode uses a dry electrode.
Before collecting the experimental data of the EEG signal, an Alpha wave blocking experiment is performed to verify the correctness of the Alpha wave acquisition of the EEG signal, as shown in FIG.

In the experiment, the experimental object performs the motion imaging task according to the experimental paradigm shown in FIG. 5.
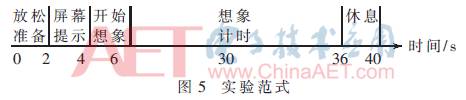
Half an hour before the start of the experiment, the subject left the actual movement feeling in the brain through the actual movement of the left and right hands and the left and right legs. In the experiment, the subject sat in a comfortable chair, the body naturally relaxed, according to the screen prompts to complete the left hand, right hand, left leg and right leg motion imagination.
3.4 Data Processing and Results
The time of each imaginary data is 30 s, the sampling rate is 512 Hz, and the raw data is shown in Figure 6.
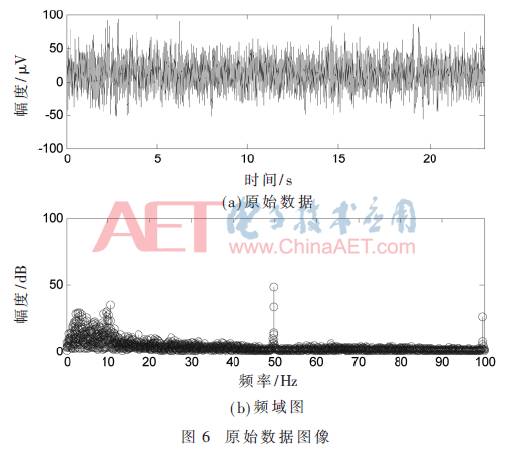
First enter the raw data into the bandpass filter, filter out the Alpha wave, then enter the 50 Hz notch filter, filter out the power frequency interference, and finally demodulate the wavelet packet to make the data better processed. The filtered image of the original data is shown in Figure 7.
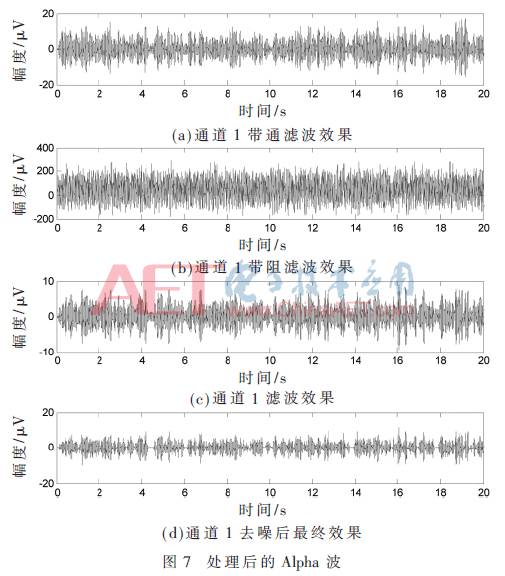
After the original data is processed by filtering, the eigenvalue extraction and classification training are performed.
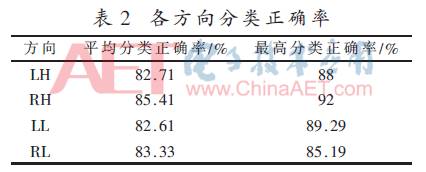
Table 2 shows the classification accuracy of each direction of motion imaging.
4 Conclusion
This study innovatively uses a variety of features combined with BP neural network to analyze EEG signals. After extracting the appropriate data segment, the final classification result is higher than the single feature and linear classifier method. It proves that the multi-feature fusion method combined with BP neural network can deal with the EEG signal. It provides an effective path for the processing of EEG signals.
The OEM pressure core with high performance and high stability is used as the signal measuring element. The sensor signal is converted into standard signal output after special signal processing. After long-term aging and stability screening, the product performance is stable and reliable. It is applied to the outdoor site with poor environment. At the same time, it can display the field pressure, and the zero point and full range can be moved.
Jb400 pressure transmitter installation interface form can not only be processed according to the user's requirements, but also provide specifications compatible with other brands of transmitters. This series of products are widely used in industrial process control, petroleum, chemical industry, metallurgy and other industries.
Marine Pressure Sensor,Marine Pressure Measuring Sensor,Stainless Steel Marine Pressure Sensor,Pressure Sensor For Marine
Taizhou Jiabo Instrument Technology Co., Ltd. , https://www.taizhoujbcbyq.com