![<?echo $_SERVER['SERVER_NAME'];?>](/template/twentyseventeen/skin/images/header.jpg)
Ren Hua
1 Ankerui Electric Co., Ltd., Jiading, Shanghai 201801, China;
Abstract: This paper introduces the third phase of Zhejiang Luyu Environmental Protection Co., Ltd., which uses integrated protection devices, intelligent power meters, and ASD switchgear integrated measurement and control devices to collect various electrical parameters and status signals from the power distribution site. The system adopts the on-site local networking mode. After networking, it communicates through the fieldbus and travels to the background. Through the Acrel-2000 power monitoring system, the real-time monitoring and management of the power distribution and distribution circuit of the substation is realized.
Keywords: Zhejiang Luyu Environmental Protection Co., Ltd. Phase III Project; 10KV Substation; Integrated Protection Device; Intelligent Power Meter ; ASD Switchgear Integrated Measurement and Control Device; Acrel-2000 ; Power Monitoring System .
- Overview
Luyu Environmental Protection, established in October 2012, is an environmentally-friendly high-tech enterprise focusing on the recycling of waste resources. The company is mainly committed to the recycling and utilization of waste textiles. It is the first to propose the concept of “full-circulation green fiberâ€. The innovation designs low-energy, low-emission industrial production systems from source to end, and realizes multiple stages of textile fiber from cradle to cradle. The second closed-loop cycle, design and establish a green low-carbon, clean production development model, create a better society with green and environmental protection, create a green era, and create a green life.
The project undertakes the construction of the power monitoring system of the third-phase engineering substation. The project has a total of 2 10KV incoming lines, 10kV/0.4kV power distribution room total installation, T1 and T2 transformers installed in POY low voltage power distribution room, T3 The T4 transformer is installed in the alcohol solution polymerization low-voltage power distribution room. The 10KV substation integrated protection device, temperature controller, DC screen, ASD switchgear integrated measurement and control device and other equipment use RS485 bus network to access the power monitoring system. The system host is installed at 10KV. Substation duty room, 10kV/0.4kV power distribution room power meter and temperature controller are connected to the power monitoring system through RS485 bus networking and fiber optic networking.
- demand analysis
There are three power distribution rooms on the site, namely 10KV substation, POY low voltage distribution room, alcoholysis polymerization low voltage distribution room. Power monitoring systems need to implement centralized data management, analysis and processing. The approximate functional requirements of the software are as follows:
Monitoring information such as voltage, current, power, power factor and frequency is refreshed in real time and displayed visually and dynamically in a single graph. Each loop sub-screen displays information such as the electrical parameters and circuit names of the loop.
A trend curve is drawn for the current of each loop to facilitate analysis of the distribution operation conditions of the loop.
The power collection function of each loop can generate power consumption reports that meet customer management requirements during the time period.
Real-time communication status display for each loop meter.
Multi-user rights management for easy hierarchical operation.
This technical condition applies to the transformer and power distribution room of the third phase of Zhejiang Luyu Environmental Protection Co., Ltd. Supplier products should be highly safe and reliable, easy to expand, and easy to maintain and maintain. The products provided by the supplier shall meet at least the technical conditions, but not limited to this, and its technical performance shall meet the requirements for data monitoring of the power distribution room.
2 system solution
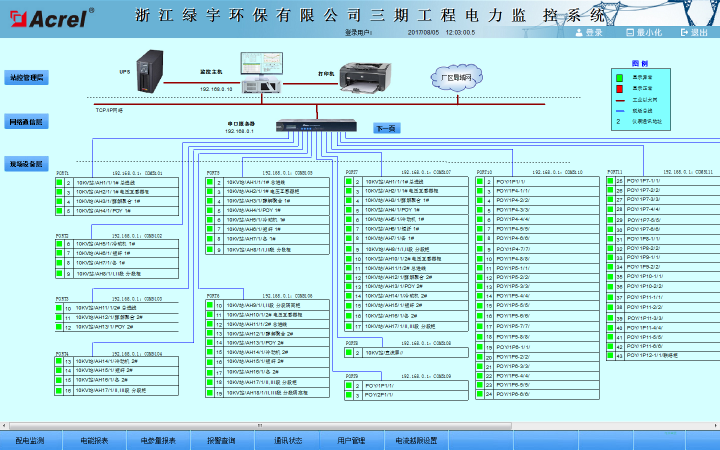
The monitoring system mainly realizes power consumption monitoring and power management for the transformer substation of Zhejiang Luyu Environmental Protection Co., Ltd. Monitoring range is 10KV transformer room integrated protection device, temperature controller, DC screen, ASD switchgear integrated measurement and control device; POY low voltage distribution room transformer temperature controller, low voltage multi-function instrument; alcohol solution polymerization low voltage distribution room Transformer temperature controller, low voltage multi-function meter. The system is connected to 15 AM5 integrated protection devices of 10KV substation, 16 PZ80 multi-function meters, 1 DC screen, 18 ASD200 switchgear integrated measurement and control devices, which are divided into 8 buses, and the bus directly connects to the serial port of the substation. Server; POY low-voltage power distribution room 83 multi-function meters, 2 transformer temperature controllers, divided into 5 buses, bus directly connected to the serial server in the second layer 10KV substation; alcohol-decomposed polymer low-voltage power distribution room 61 multi-function Instrument, 2 transformer temperature controller, divided into 4 buses, the bus directly accesses the data acquisition box in the substation, uploads data to the 10KV substation duty room host through optical fiber, thus realizes the instrument on the bus on the monitoring host. Monitor the data connectivity of the host. As shown in the figure below: station management layer, network communication layer and field device layer.

System network topology
1) Station management
The management of the station control management system for the power monitoring system is a direct window for human-computer interaction. In the main refers to the industrial computer, display, UPS, etc. placed in the duty room.
2) Network communication layer
The communication layer is mainly composed of N2S16-485I-ETS serial server, Ethernet device and bus network. The main function of N2S16-485I-ETS serial server is to monitor on-site intelligent instrument, integrated protection device, DC screen, transformer temperature controller; the main function of Ethernet equipment and bus network is to realize data interaction, make distribution system management centralized, information It is intelligent and intelligent, which greatly improves the safety, reliability and stability of the power distribution system, and truly achieves the goal of unattended operation.
3) Field device layer
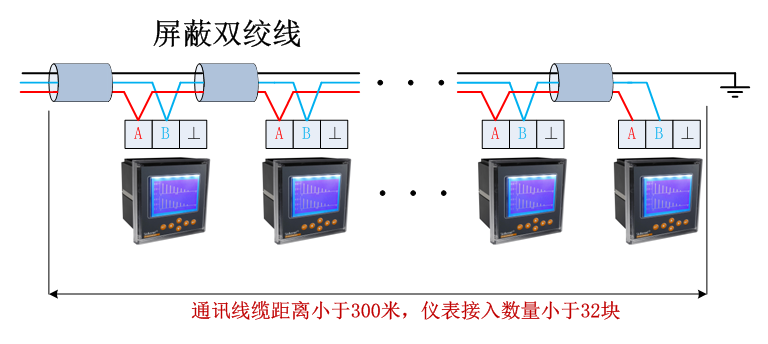
The field equipment layer is a data acquisition terminal, which is mainly composed of Ankerui intelligent instrument, AM5 integrated protection device, DC screen, transformer temperature controller and ASD switchgear integrated measurement and control device. The instrument adopts shielded twisted pair RS485 interface and adopts MODBUS communication protocol. The bus type connection is connected to the communication server, and the communication server arrives at the distribution room monitoring host to perform networking to realize remote monitoring.
Smart meter field connection
The on-site instrument communicates hand-in-hand through the shielded twisted pair cable (RVVSP2*1.0). The number of smart meters connected to each bus is about 20, and then the data is uploaded to the serial port server, and the data is uploaded to the local monitoring terminal. The specific connection diagram is as follows:
The low-voltage incoming and feeder loops use multi-function meters that measure all conventional power parameters such as three-phase voltage, current, power factor, frequency, active energy, and reactive energy.
3 system functions
Features
The system adopts full Chinese interface, and the operation is simple and convenient; the operation is stable and reliable; the system has a system diagram display, simulation diagram display and network structure diagram display; the system provides a friendly human-computer interaction interface, and all operations can be performed on the interface. And has a remote display function.
login interface
In order to ensure the safe and stable operation of the system, the user rights management function is set. Unauthorized operations (such as power distribution loop name modification, etc.) can be prevented by user rights management. Define the login name, password, and operation authority of users of different levels to provide reliable security for system operation and maintenance management. The user's level is divided into three levels: operator, engineer, and system administrator. Each level can be assigned to different operation rights, including entering operation, exiting operation, and report management. The system administrator is the highest level user, and the higher level user can add and delete the next level of users. 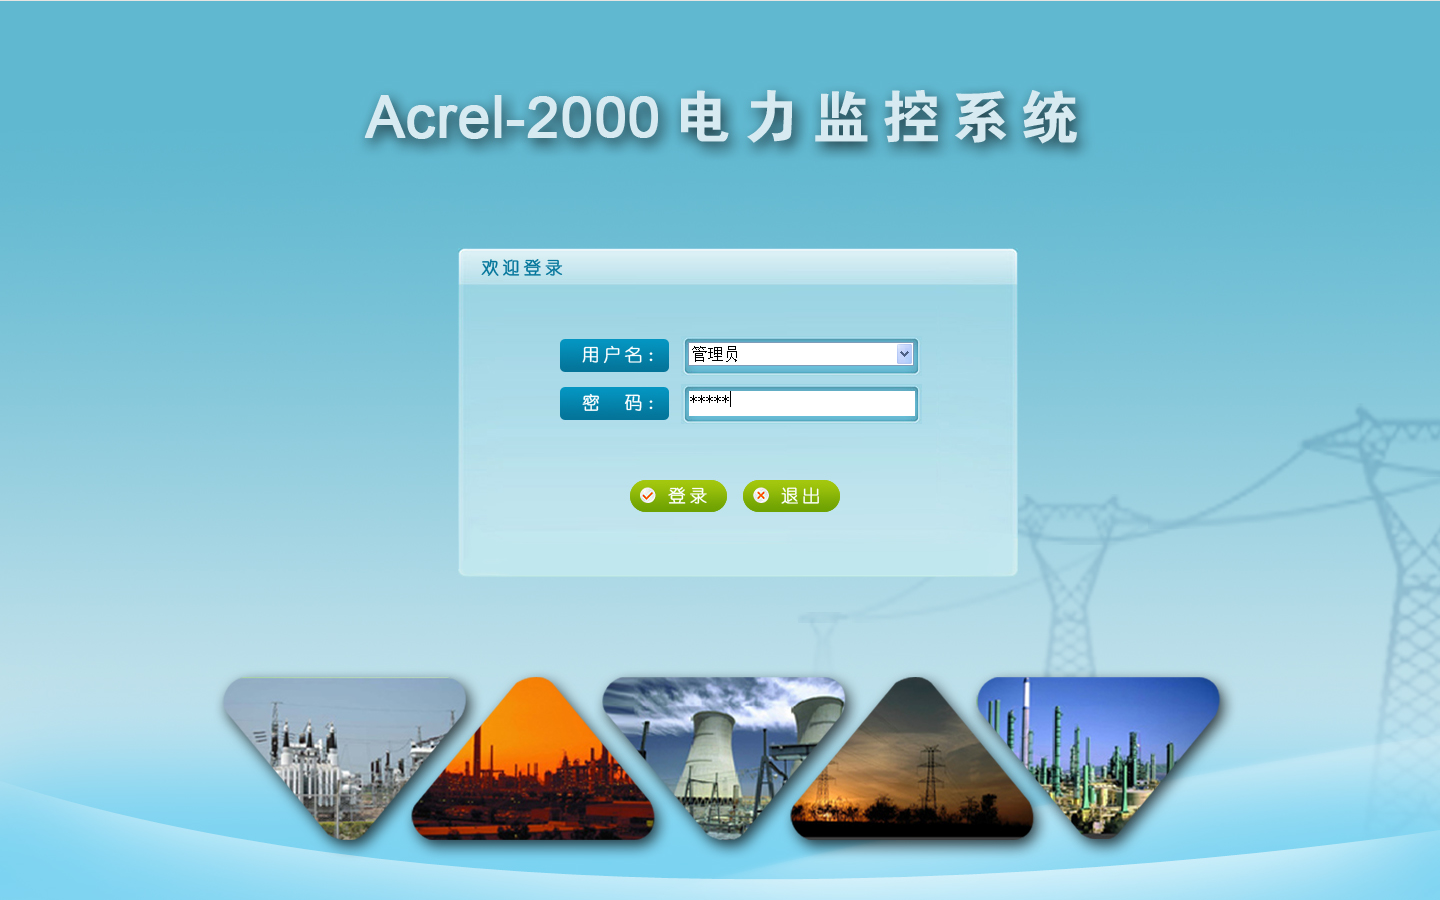
The monitoring system interface is divided into three parts, the title interface, the power distribution system interface and the menu switching interface.
The current time of the currently logged in user and system is displayed in the title interface.
The system interface displays various parameters corresponding to the current interface.
The buttons arranged on the menu switching interface are the function switching buttons of the system. Different function buttons can enter the corresponding function interface.
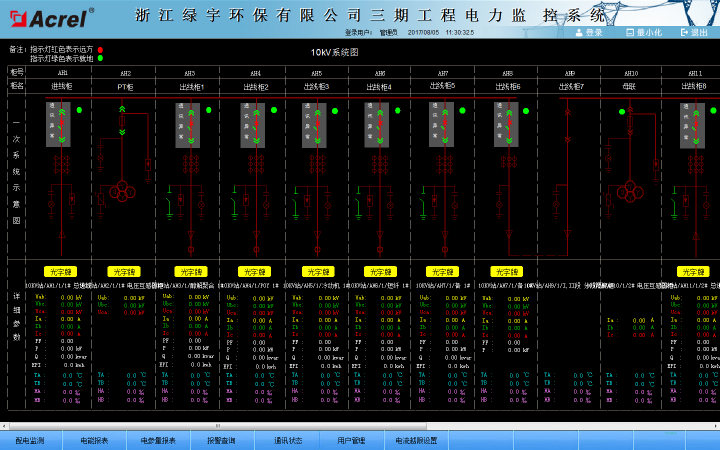
Power distribution monitoring interface
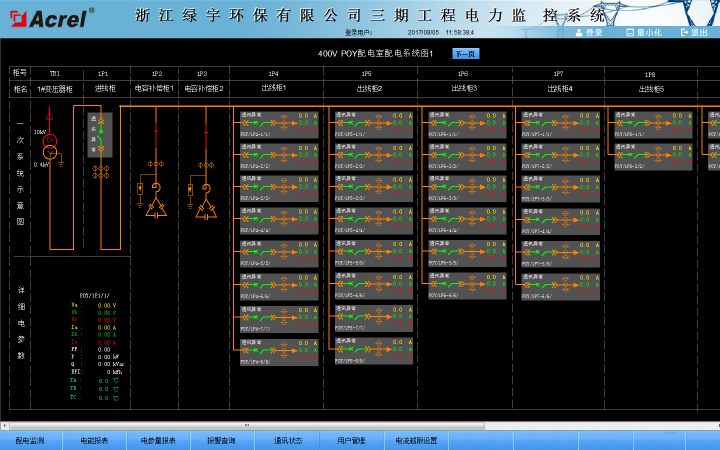
Power distribution monitoring function
You can view the distribution and connection of each distribution circuit as well as the main electrical parameters. The main data includes: three-phase current, electrical energy. The number above the busbar (above the horizontal line in the figure) (eg 1P1) represents the switchgear
When you choose to log in to the system as “Administratorâ€, you can click the loop name in the system map to modify the loop name directly. After the modification, the system will automatically save it.
Communication status
The real-time display of the communication status of each device in the access system can completely display the entire system network structure, and can diagnose the network communication status of the system online. When a network failure occurs, the fault unit and the fault location can be automatically displayed on the screen. Therefore, the system maintenance personnel can grasp the communication status of each device in the real-time, and timely maintain the abnormal equipment to ensure the stable operation of the system.
Communication status map
The communication status can see the distributed network structure of the entire system, which has network diagnostics. It can monitor the network communication status of the system in real time. When a network failure occurs, the system automatically displays the fault line and specific unit. Red indicates that the communication is normal, and green indicates that the instrument communication is out of line. Inform the maintenance personnel in time to check the cause of the failure.
Electrical parameter report
Real-time power parameters and historical power parameters storage and management functions, all real-time data collected, sequential event records, etc. can be saved to the real-time database. In the monitoring screen, you can customize the parameters that need to be queried, the time period of the query, or select the number of records that have been updated recently, and display them in a report mode. This feature makes it easy for users to conduct accident tracking queries.
Set the time you need to query, click the Query button to query the electrical parameter report of each loop at a certain time in history. The main data includes: three-phase voltage, three-phase current, active power, reactive power, power compensation factor, and electrical energy.
This report contains all the loops. Help users to understand whether voltage instability, current limit, power and power factor meet the requirements during system operation. Based on this, the system is better managed and optimized.
Reports can be exported as a spreadsheet with print capabilities. Click Print Report to print the report as needed.
Energy report
The integrity of the measurement system is reflected in a rich data report. The system has the function of counting and counting the periodic meter reading of each loop. The user can freely query the power consumption of each power distribution node in any time period since the normal operation of the system, that is, the statistical analysis of the power consumption of the incoming line of the node and the power consumption of each branch circuit. Report. This function makes the electricity use visible and transparent, and can be traced when the power consumption error is too large to maintain the correctness of the measurement system.
Energy report function
The management of power consumption is presented in the form of a report. The report can display the power consumption of each loop in any period of time during the system operation. Each incoming loop and its outgoing loop are made in a table, which is convenient for querying. .
By adjusting the start time and end time, you can display the power consumption during this time period.
The report can be exported as a spreadsheet with print capabilities.
Current limit setting
A current limit setting is designed for each circuit of the power distribution system. It is convenient for the distribution and maintenance personnel to change the set value of the electric current according to the on-site electricity demand. When the current exceeds the limit, the power supply of the loop is controlled in time to ensure the reliability of the power supply and provide protection for the user's energy use rights.
Current limit setting
Alarms and events
Real-time alarm
The real-time alarm window monitors the telemetry collected by the system. The alarm window opens automatically when the system is running and remains hidden in the background.
When there is current or voltage limit and the alarm limit is reached, the “Real-time real-time alarm†window will pop up automatically, and the specific alarm information will be displayed in red font: loop name, over-limit electric parameter, alarm value, etc.
Historical alarm
By adjusting the start time and end time, you can query the system alarm information in any past time period, including telemetry alarm and remote alarm, including the specific alarm time, alarm type, alarm content and so on.
4 Conclusion
In today's power distribution facilities, the distribution safety of the substation is very important. The application of the Acrel-2000 power monitoring system introduced in the third phase of Zhejiang Luyu Environmental Protection Co., Ltd. can be realized for the substation. The real-time monitoring of the power distribution circuit can not only display the power consumption of the circuit, but also have the network communication function, and can form a power monitoring system with a serial port server and a computer. The system realizes the analysis and processing of the collected data, displays the running status of each distribution circuit in the substation in real time, and has pop-up alarm dialog box, voice prompt, short message report, and generates various energy reports for the closing and closing of the load. Analyze curves, graphs, etc., to facilitate remote meter reading and analysis and research of electric energy. The system is safe, reliable and stable, which provides a real and reliable basis for the factory to solve the problem of electricity consumption, and has achieved good business benefits.
references:
[1]. Ren Zhicheng Zhou Zhong. Principles and Application Guide of Digital Measurement of Electric Power Measurement [M]. Beijing. China Electric Power Press. 2007. 4
[2]. Zhou Zhongbian. Smart grid customer power monitoring and power management system product selection and solution [M]. Beijing. Mechanical Industry Press. 2011.10
About the Author:
Ren Hua, male
, undergraduate. Position: Now working for Ankerui Electric Co., Ltd.
Contact phone, mobile phone, QQ
A slip ring is an electromechanical device that allows electricity and data to pass through a rotating assembly. A mercury slip ring uses liquid mercury as the electrically conductive element inside the rotating assembly, as opposed to traditional carbon brushes. Mercury is a better conductor of electricity than carbon, and it also has a very low contact resistance. This makes it an ideal choice for applications that require high-speed data transmission or where reliability is critical. Mercury slip rings are used in a variety of industries, including medical technology, aerospace, and defense.
Why do we choose a mercury slip ring?
A slip ring is an electromechanical device that allows electrical current to pass between rotating objects. Slip rings are often used in applications where a cable or connector would otherwise twist and tangle as the object rotates. There are many different types of slip rings, but one of the most common is the mercury slip ring. Mercury slip rings offer several advantages over other types of slip rings, including high reliability, low maintenance, and long life. Here are three reasons why we choose a mercury slip ring:
1. Reliability: Mercury is an extremely reliable material, and mercury slip rings are among the most reliable types of slip rings available. Mercury has a very low failure rate, and it is not affected by changes in temperature or humidity. This makes mercury slip rings ideal for critical applications where reliability is essential.
2. Low Maintenance: Mercury slip rings require very little maintenance. Because mercury is a very inert substance, it does not corrode or generate any corrosive gases that would affect its reliability. Mercury slip rings do not require any lubrication, and they can operate in a wide range of temperatures and environments.
3. Economical Mercury slip rings have a lifetime cost advantage over other types of slip rings as well. Generally speaking, mercury slip rings are approximately 25% more expensive per kilowatt than other types of slip rings. However, because they require less maintenance and have a greater degree of reliability than other types of slip rings, they will save you money over the lifetime of your equipment.
Mercury Slip Ring,Slip Ring Gigabit Ethernet,Slip Ring 400V,Slip Ring Pneumatic
Dongguan Oubaibo Technology Co., Ltd. , https://www.sliprobs.com