![<?echo $_SERVER['SERVER_NAME'];?>](/template/twentyseventeen/skin/images/header.jpg)
1 Introduction
In today's era of scarce resources, low-carbon economy, energy-saving emission reduction, green lighting and other related topics are not uncommon, and the state-advanced LED solid-state lighting technology has developed rapidly. LED chip maker Cree announced in March 2010 that its chip efficacy reached 208 lm / W (laboratory data), and its mature flagship product has exceeded 130 lm / W. It can be foreseen that the LED light source will soon reach and exceed the light efficiency of the traditional light source, and its energy-saving benefits gradually emerge. However, in the development process of road lighting fixtures, there are still many technical difficulties, such as power loss, heat dissipation technology, secondary optical design, etc., which makes the overall light efficiency of the lamps greatly reduced, and the efficiency of the lighting system is less than 75lm /W. So far, LED road lighting is still in the demonstration stage of government-led demonstration. The entire LED road lighting industry lacks practical application experience. There is a certain gap between lighting development and lighting applications, for example, secondary lighting design and application of lamps. The gap in demand causes the output luminous flux of the LED road luminaire to be projected onto the road surface, and there is a problem that the brightness is insufficient or the utilization factor is too low, which results in an energy saving effect of the LED road lighting. This paper will discuss how to improve the energy-saving effect of LED road lighting fixtures from the perspective of light distribution design. It is necessary to evaluate the light distribution performance of road lighting fixtures by using the coefficient CU and the illumination brightness ratio E / L in addition to the illumination brightness uniformity index. Good or bad, and summed up the problems in the design of road lighting.
2 Two important indicators for evaluating the performance of road lighting design
In the LED lighting industry, energy conservation is one of the main highlights of speculation, but from the experience of actual engineering cases, its energy-saving effect is far less impressive than the manufacturers claim, if without sacrificing lighting levels and effects, Not even as efficient as traditional high pressure sodium lamps. There are many reasons for this. For example, the problem of heat dissipation technology causes the phosphor to age after being heated, and its conversion light efficiency is reduced. When power supply is lost, many manufacturers do not consider the system light effect caused by power loss when evaluating the LED energy saving effect; The problem of secondary light distribution, the illuminating of many lamps is unreasonable, resulting in a lot of light flowing out of the road surface, and some of the light is irradiated to the area far away from the road, which not only wastes energy, but also causes adverse effects such as light pollution and light intrusion. There is a lack of technical indicators in the industry to evaluate the performance of light distribution, and optical engineers in the industry do not understand the application requirements of road lighting. When they are doing LED lighting design, the main goal is to meet the CJJ45-2006 urban road lighting design. The technical parameters specified in the standard for uniformity and glare are not enough for what kind of light distribution is more suitable for road lighting. The CJJ45—2006 standard is mainly a specification for road lighting design, and has limited constraints on the design of road lighting design. Moreover, the standard is mainly based on traditional light sources, and the binding force is very low for the LED road lighting.
What kind of light distribution is more suitable for road lighting? In short, it is to use less light to achieve the technical parameters specified in the road lighting specifications, and to improve the uniformity and reduce the glare value as much as possible. However, in the design of the light distribution, the lack of technical indicators to evaluate the quality of the light distribution, resulting in a mixed situation in the industry. A good light distribution design, first of all to meet the illumination uniformity, has reached a consensus in the industry, the general optical software can achieve illumination uniformity simulation. Since there is no optical software loading road surface brightness coefficient library, optical designers can not simulate the uniformity of road surface brightness of different materials, so most of the light distribution design in the industry can not meet the brightness uniformity UL or overall uniformity UO, even the industry There is still not enough knowledge of brightness uniformity. In addition to satisfying the illuminance and brightness uniformity, it is also necessary to consider whether the utilization factor is high, whether the ratio of illuminance to brightness is low enough, and whether there is an energy saving effect. After studying and comparing the light distribution curves of different manufacturers, the author proposes to use the utilization coefficient CU and the illumination brightness ratio E / L to evaluate the light distribution performance, which is enough to highlight its optical properties.
The pros and cons of energy.
2. 1 Coefficient of Utilization
The utilization factor refers to the percentage of the luminous flux received by the road calculation surface as a percentage of the total luminous flux output by the luminaire. It can be calculated by the formula (1). The relationship between the coefficient CU and the average illuminance E and the power density LPD is obtained by the formulas (2) and (3). It can be seen from equation (3) that the power density LPD is inversely proportional to the utilization factor CU, that is: the utilization factor CU can be used to directly reduce the power density LPD value to achieve the effect of energy saving. Only the light distribution design with high coefficient can ensure the road surface has Sufficient illumination and brightness. In the traditional road lighting industry, the denominator part of formula (1) has been defined as the luminous flux of the light source. Since the luminous flux of the LED light source is more complicated by the influence of the luminaire, the luminous flux of the traditional light source is difficult to define. This paper recommends using the luminous flux of the luminaire to define Use coefficients to facilitate calculations and promotion of this technical indicator.
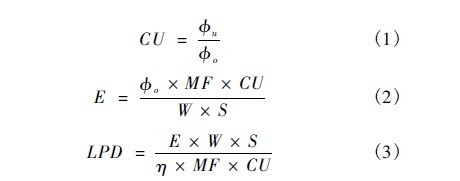
CU--utilization coefficient;
u———the luminous flux that is irradiated to the calculation surface of the road, in units of lumens;
o———The total luminous flux output by road lamps, in units of lumens;
E———average illumination, unit: lux;
MF———Maintenance factor, the illuminance reduction factor caused by the decrease of luminous flux output of the luminaire during the use of the luminaire;
W———Road road width, unit: meter;
S———light pole spacing, unit: meter;
η ———System light efficiency of the luminaire, the output luminous flux of the complete set of LED luminaires divided by the power consumption, unit: lumens / watt;
LPD—Power density, the power consumption per unit of area.
In general, the lower the height of the pole and the wider the road, the higher the utilization factor. Figures 1 and 2 show the relationship between the utilization factor CU and the aspect ratio (W / H). If the lateral light distribution design of the luminaire is too wide (as shown in Figure 1), when applying to a narrower road (such as 2 to 3 lanes), the utilization factor is too low, causing serious energy waste; The lateral light distribution design is too narrow (as shown in Figure 2), and when applied to wider roads, there is a problem of reduced uniformity.


2. 2 illuminance brightness ratio (E / L)
The illuminance brightness ratio refers to the ratio of the average illuminance to the average brightness of the road calculation surface, which can be calculated by the formula (4):

Eavg—the average illuminance in the road calculation plane;
Lavg—The average brightness in the road calculation plane.
The technical indicators are related to the type of light distribution of the luminaire, the material of the road surface, the incident angle of the light to the road surface, the position of the observer and the direction of the line of sight. For road lighting, the position of the observer recommended by the International Lighting Society is calculated from the distance road. The position is 60 meters away and the height is 1.5 meters. JTJ 026. 1-1999 The recommended asphalt pavement E / L ratio in highway tunnel ventilation lighting design is based on 15 to 22, and the cement pavement E / L ratio is based on 10 to 13. According to the author's experience, the optimized design of the light distribution can make the ratio lower, even lower than the recommended range of the specification, that is: higher brightness can be achieved with less luminous flux [1]. If the design of the light distribution is unreasonable, it may cause the E / L ratio to be too large, even exceeding the recommended value range, resulting in the problem that the illumination is up to standard and the brightness is not enough. According to CJJ45-2006, the standard of brightness 2cd / m2 corresponds to 30lx illuminance, and the illuminance brightness ratio E / L is based on 15 values. According to the author's experience, when applied to the R3 asphalt pavement recommended by the standard, general road lamps are equipped with The illuminance ratio of light is in the range of 14 to 19 [1], that is, an illumination of 28 to 38 lx is required to achieve a brightness level of 2 cd / m 2 on the R3 asphalt pavement. That is to say, by reducing the luminance ratio, it is possible to achieve an energy saving effect of 10% to 25%.
3 Examples of evaluating light distribution performance using CU and E/L technical indicators
The author selects 10 models (as shown in Figures 3 to 4). The light distribution curves from different manufacturers, in order to facilitate comparative analysis, correct the output luminous flux, select the total luminous flux of 120W total lamp power output is 9000lm (according to the system luminous efficiency 75lm / W Calculation). In the calculation process, the pavement material is selected from the R3 asphalt pavement, and the maintenance factor is taken according to 0.7. The 10 light distribution curves are respectively applied in different typical lighting scenes, and the calculation results of various scenes are compared, and the various light distributions are summarized. The performance is good or bad, as shown in Tables 1 to 4. The application scenarios in Table 1 are: road width is 7 m 2 lanes, 30 m single-sided cloth light, lamp pole height 8 m (distance ratio is 3.75); the scene in Table 2 is: road width is 10 5 m 3 lanes, 30 m single-sided cloth, 8 m (light height ratio 3.75); The scene in Table 3 is: Road width 25 m bidirectional 6 lanes (including 1 m intermediate barrier) ), the bilateral symmetric spacing of 30 meters, the height of the pole is 8 meters (the height ratio is 3.75); the scene in Table 4 is: the road width is 25 meters bidirectional 6 lanes (including 1 meter intermediate isolation belt), double The side symmetrical spacing is 30 meters, and the height of the pole is 10 meters (the height ratio is 3.0).
